

AI Summary
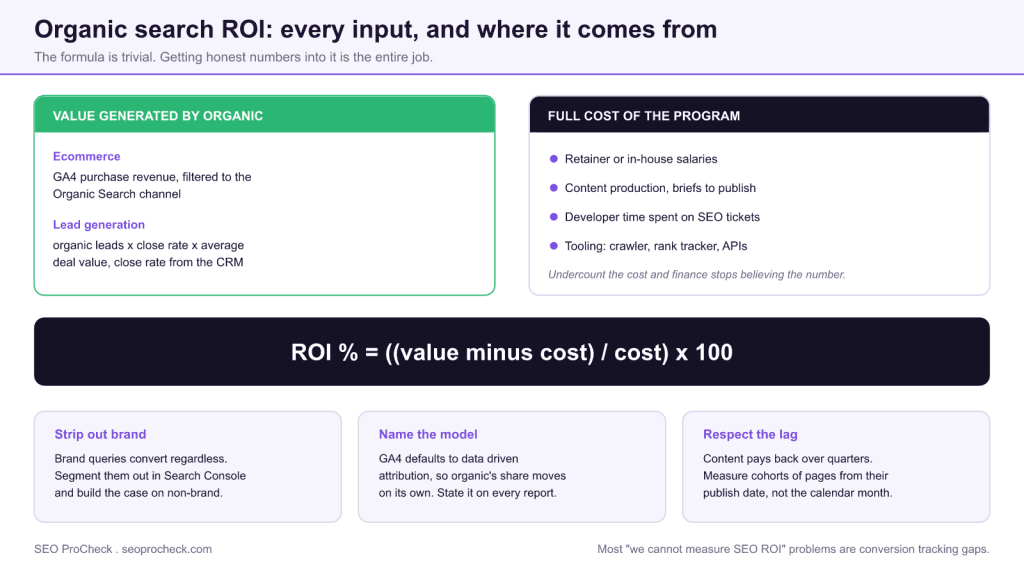
Organic search ROI is the value organic traffic generated minus the full cost of the SEO program, divided by that cost, expressed as a percentage. The formula is trivial; the work is sourcing honest inputs, because most teams who say they cannot measure SEO ROI actually have a conversion tracking gap rather than a measurement model problem.
- Value comes from GA4 revenue for ecommerce, or organic leads times CRM close rate times average deal value for lead generation.
- Cost has to include content, developer time, and tooling, not just the retainer. Undercounting it is what makes finance distrust the number.
- Segment brand from non-brand in Search Console and build the case on non-brand growth, which is the number that survives scrutiny.
- Measure cohorts of pages from their publish date. Content shipped this quarter typically pays back across the following two to four.
Quick answer: Organic search ROI is calculated as (value generated by organic traffic - cost of the SEO program) ÷ cost of the SEO program, expressed as a percentage. The hard part is not the formula but the inputs: value comes from assigning revenue or conversion value to organic sessions in GA4 (or your CRM for lead-gen), and cost must include content, development, and tool spend, not just the SEO retainer. Most teams that "can't measure SEO ROI" actually have a conversion-tracking gap, not a measurement-model gap.
The Core Formula and Its Inputs
The base calculation every stakeholder understands:
SEO ROI % = ((organic revenue - SEO cost) / SEO cost) × 100
For e-commerce, organic revenue comes straight from GA4 e-commerce reporting filtered to the organic channel. For lead-gen, substitute leads × lead-to-close rate × average deal value, pulling the close rate and deal value from the CRM, not from marketing assumptions. On the cost side, count everything the program consumes: retainer or salaries (including a realistic share of developer and writer time), tools, and content production. Undercounting cost is the fastest way to publish an ROI number nobody in finance believes.
Metrics, Formulas, and Where the Data Lives
| Metric | Formula | Data source |
|---|---|---|
| Organic revenue (e-com) | Sum of purchase revenue, organic sessions | GA4: Reports > Life cycle > Acquisition > Traffic acquisition, filtered to "Organic Search", with the Revenue metric |
| Organic lead value | Organic leads × close rate × avg deal value | GA4 key events + CRM (HubSpot/Salesforce) for close rate and deal size |
| SEO program cost | Retainer/salaries + content + dev time + tools | Finance/accounting, invoices, time tracking |
| ROI | ((value - cost) / cost) × 100 | Derived |
| Traffic value (proxy) | Σ (clicks per keyword × equivalent CPC) | GSC queries + Google Ads/third-party CPC data |
| Payback period | Cumulative cost / monthly incremental value | Derived, tracked monthly |
| Assisted conversions | Organic-touched conversion paths | GA4: Advertising > Attribution paths |
The "traffic value" row deserves a caveat: valuing organic clicks at their equivalent paid CPC is a defensible proxy for content programs with no direct conversion path, but present it as cost savings, never as revenue. Mixing the two in one report destroys credibility with finance teams.
Understanding Analytics
Analytics represents a critical component of modern SEO strategy. As search engines continue to evolve and user expectations shift, understanding the nuances of analytics becomes essential for maintaining and improving organic visibility. This guide covers the key concepts, implementation approaches, and strategic considerations that SEO practitioners need to master.
Key Considerations for Measuring Organic Search ROI
When approaching analytics, several factors require careful attention. Technical implementation must align with broader SEO objectives while maintaining site performance and user experience. The balance between optimization and over-optimization requires ongoing monitoring and adjustment based on performance data and algorithm changes. Industry benchmarks and competitor analysis provide context for evaluating your own implementation.
Three ROI-specific considerations trip up most reporting setups. First, attribution: GA4 defaults to data-driven attribution, so organic's reported share shifts as the model reweights, so note the model on every report. Second, brand versus non-brand: brand queries would convert regardless of SEO effort, so segment GSC queries (a regex filter like ^(?!.*yourbrand).*$ on the query dimension) and claim credit primarily for non-brand growth. Third, the lag: content shipped this quarter typically pays back over the following two to four quarters, so measure cohorts of pages from publish date rather than judging the program month-to-month.
Implementation Best Practices
Successful implementation begins with thorough auditing of current state and clear goal definition. Document baseline metrics before making changes to enable accurate impact measurement. Prioritize changes based on potential impact and implementation effort, focusing on high-impact items first. Test changes in staging environments when possible, and monitor closely after deployment to production. Maintain documentation of changes for future reference and troubleshooting.
Concretely, before claiming any ROI: verify key events fire on the actual conversion (thank-you page or server-side event, not button click), assign a monetary value to each key event in GA4 (Admin > Events > Mark as key event, then set value via the event parameter), and annotate deploy dates: GA4 dropped native annotations, so keep a shared changelog of releases, migrations, and algorithm updates next to the reporting. Without that changelog, every traffic change becomes an unresolvable argument six months later.
Common Mistakes to Avoid
Several patterns consistently cause problems in analytics implementations. Rushing implementation without proper planning leads to errors that can be costly to fix. Ignoring the interplay between different SEO factors creates conflicts that undermine results. Failing to monitor and iterate based on performance data means missing optimization opportunities. Over-optimization signals can trigger algorithmic penalties that take months to recover from.
Specific to ROI reporting: counting brand traffic as SEO-driven value, comparing GSC clicks to GA4 sessions as if they were the same number (they never reconcile: different collection methods, different definitions), ignoring consent-mode data loss in EU traffic, and reporting last-click only, which systematically undervalues informational content that opens the journey.
Measuring Success
Effective measurement requires defining appropriate KPIs aligned with business objectives. Track both leading indicators (rankings, impressions, technical metrics) and lagging indicators (traffic, conversions, revenue) to build a complete picture. Establish reasonable timeframes for evaluation, as SEO changes often take weeks or months to fully manifest in results. Compare performance against historical baselines and competitor benchmarks to contextualize results.
A reporting cadence that holds up in practice: weekly: GSC impressions and clicks by page group (leading indicators only, no ROI claims); monthly: organic conversions and value versus prior period and year-over-year; quarterly: the full ROI calculation with cost ledger, cohort performance of new content, and payback tracking. Year-over-year is the honest comparison for organic; month-over-month mostly measures seasonality.
Strategic Recommendations
Approach analytics as an ongoing program rather than a one-time project. Build processes for regular auditing, monitoring, and optimization. Stay current with industry developments and algorithm changes that may affect your strategy. Invest in education for team members to build internal capabilities. Consider how analytics fits within your broader digital marketing and business strategy for maximum impact.
The cost ledger: what actually goes in the denominator
ROI arguments collapse at the denominator far more often than at the numerator. Finance will accept an imperfect value estimate; they will not accept a cost figure that omits the two engineers who spent three weeks on a migration. Build the ledger once, agree it with whoever owns the budget, then reuse it every quarter:
| Cost line | What to count | Where the number comes from |
|---|---|---|
| Agency retainer or in-house salary | Fully loaded cost, salary plus employment overhead, for the share of time on SEO | Invoices, or finance's loaded-cost figure multiplied by the time-tracking split |
| Content production | Briefing, writing, editing, subject-matter review, images, and publishing time | Freelance invoices, or internal hours at loaded cost per published piece |
| Developer and design time | Sprint capacity consumed by SEO tickets, including QA and rollback work | Jira or Linear time tracking, filtered to the SEO epic or label |
| Tooling | Crawler, rank tracker, backlink and API subscriptions used by the program | The SaaS billing export, apportioned if a tool is shared with other teams |
| Migration and platform work | One-off spend on replatforming, CDN, or rendering changes driven by SEO | The project budget, amortised across the quarters it benefits |
Amortising is where judgement enters. A migration that took a quarter of engineering capacity should not be dropped entirely into one month's ROI calculation, because its benefit runs for years. Spread it over a defensible horizon, state the horizon in the report, and keep it consistent. What destroys credibility is not the choice of horizon, it is quietly changing it once the number stops looking good.
A worked example, cohort by cohort
Illustrative figures, not benchmarks: substitute your own. The point is the shape of the calculation, and specifically what it looks like when you stop judging the program month to month and start tracking cohorts of pages from their publish date.
| Cohort | Program cost in quarter | Non-brand organic value, Q1 | Q2 | Q3 | Cumulative ROI by Q3 |
|---|---|---|---|---|---|
| Q1 pages (18 published) | 60,000 | 9,000 | 44,000 | 71,000 | ((124,000 - 60,000) / 60,000) x 100 = 107% |
| Q2 pages (15 published) | 52,000 | n/a | 7,000 | 38,000 | ((45,000 - 52,000) / 52,000) x 100 = -13% |
| Q3 pages (16 published) | 55,000 | n/a | n/a | 6,000 | Too early to judge, leading indicators only |
Read the second row carefully, because it is the one that gets programs cancelled. The Q2 cohort looks like a loss at the end of Q3, and by the naive month-to-month reading it is. But it is on exactly the same trajectory the Q1 cohort was on at the same age, when that cohort was also underwater. Cohort reporting is what lets you say so with evidence instead of asking for patience. Track each cohort in its own row, keep the rows for at least four quarters, and the maturation curve becomes the argument.
The corollary: never report a blended ROI number without also showing the cohort table. A blended figure lets a strong legacy cohort hide a weak new one, and the first time someone digs into it, every number you have ever presented becomes suspect.
Wiring the report so it maintains itself
An ROI model that needs three days of manual assembly each quarter gets abandoned by the second quarter. Build it so the numbers arrive on their own:
- Value layer. GA4 key events with monetary values assigned (Admin > Events > Mark as key event, then set the value parameter), so revenue or lead value is already in the data rather than applied by hand afterwards.
- Search layer. Search Console data joined by page, with a brand regex applied at query level so the brand split is automatic rather than a monthly judgement call. Joining GA4 and Search Console at the page level is what makes non-brand value attributable.
- Cost layer. A single sheet with one row per cost line per month, owned by whoever approves the spend. This is the layer teams skip, and its absence is why most ROI decks are built from memory.
- Presentation layer. A Looker Studio dashboard reading all three, with the attribution model and the cost horizon printed on the page itself so no one has to remember the assumptions.
- Changelog. A dated list of releases, migrations, and known algorithm updates sitting beside the charts. Without it, every traffic movement becomes an argument nobody can settle six months later.
Frequently Asked Questions
How do you calculate SEO ROI?
Divide the net value organic search generated (revenue or lead value minus the full program cost) by the program cost, times 100. Example: $180,000 in organic-attributed value against $60,000 of total cost is ((180,000 - 60,000) / 60,000) × 100 = 200% ROI.
How long before SEO shows a positive ROI?
For most sites, individual pages need several months to reach ranking maturity, so program-level payback typically lands in the 6 to 12 month range depending on domain authority and competition. Report leading indicators (impressions, rankings, indexed pages) in the interim so stakeholders can see the trajectory before revenue arrives.
How do I measure SEO ROI for lead generation, not e-commerce?
Track form fills and calls as GA4 key events, then multiply organic leads by your CRM's lead-to-close rate and average deal value. Close the loop by passing a channel field (hidden form field or UTM capture) into the CRM so revenue can be tied back to organic at the deal level.
Should brand traffic count toward SEO ROI?
Mostly no. Brand searches reflect demand created elsewhere; SEO's job there is defensive. Segment brand from non-brand in GSC with a query regex and build the ROI case primarily on non-brand growth: it is the number that survives scrutiny.
Why don't my GSC clicks match GA4 organic sessions?
They measure different things: GSC counts clicks from Google web search only (logged server-side by Google), while GA4 counts JavaScript-tracked sessions from all organic engines, minus users lost to consent, blockers, and tracking prevention. A 10 to 30 percent gap is normal; use GSC for search-side trends and GA4 for on-site behavior and value.
How do I show ROI for content that doesn't convert directly?
Two accepted approaches: assisted-conversion analysis (GA4 attribution paths showing organic-touched journeys) and traffic-value modeling (what the same clicks would cost in paid search). Label the second as cost avoidance, and pair both with internal-link click-through from informational pages to converting pages to demonstrate the pathway.
Claude Vincent is a technical SEO consultant focused on crawlability, rendering, and AI-search visibility. He writes the field guides and case studies at SEO ProCheck, with a bias toward the durable, unglamorous work that decides whether search engines and AI answer engines can actually read and cite a site.
About SEO ProCheck
Technical SEO consulting and GEO strategy with 20 years of enterprise experience. Case studies, resources, and tools for search and AI visibility.
Work With Me
Technical SEO audits, GEO strategy, site migrations, and international SEO. Hourly consulting for teams who need hands-on support, not just reports.
Subscribe to our newsletter!






Recent Posts
- Can AI Crawlers Actually Read Your Site? I Measured 400 of the Biggest September 5, 2026
- The Pre-Publish Quality Gate for AI-Assisted Content August 6, 2026
- AGENTS.md vs llms.txt vs llms-full.txt: Which Agent File Does What July 18, 2026