

Building SEO Dashboards in Looker Studio That People Actually Use
- December 16, 2025
- Analytics & Measurement
AI Summary
A Looker Studio SEO dashboard people actually use pairs the Search Console connector (Site Impression for pages, URL Impression for queries) with GA4 filtered to Organic Search, keeps the two in separate sections rather than blended, and refreshes daily through Extract Data. Start from the three to five decisions the report must drive, because anything that does not feed a decision is decoration.
- The two Search Console tables never reconcile: Site Impression is URL level, URL Impression is query level with heavier anonymization.
- Blending GSC and GA4 on URL usually fails, the join keys differ and left join cardinality duplicates metrics.
- Always split brand from non-brand queries and band average position into 1-3, 4-10, 11-20 and 21+ buckets.
- Use Extract Data with an overnight refresh to kill live query sampling, and note that GSC history is capped at 16 months.
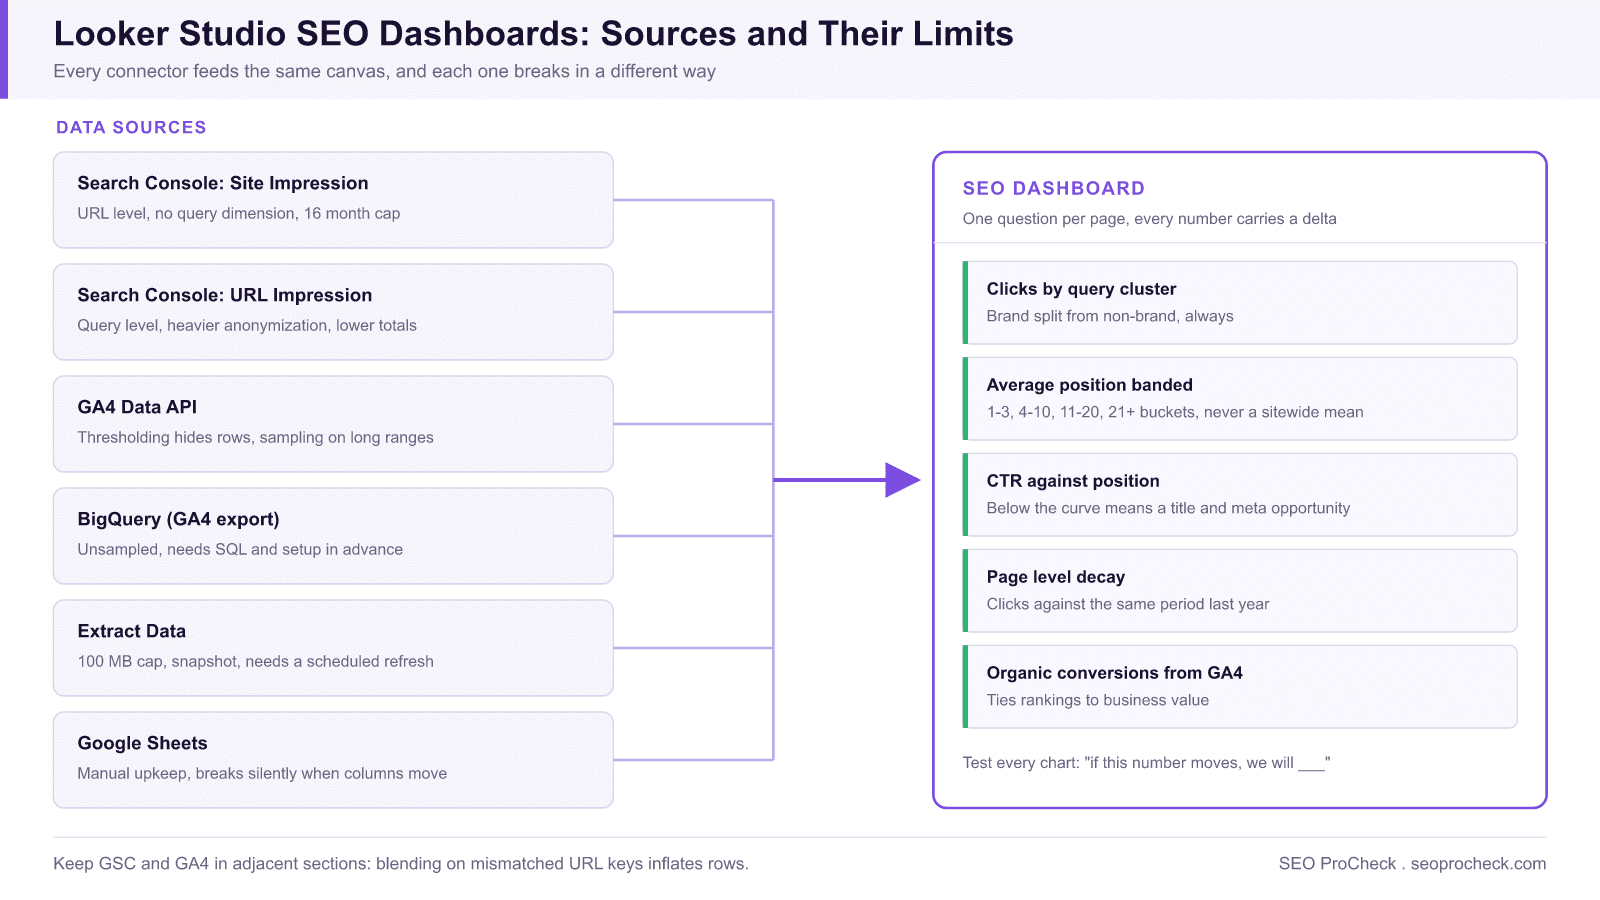
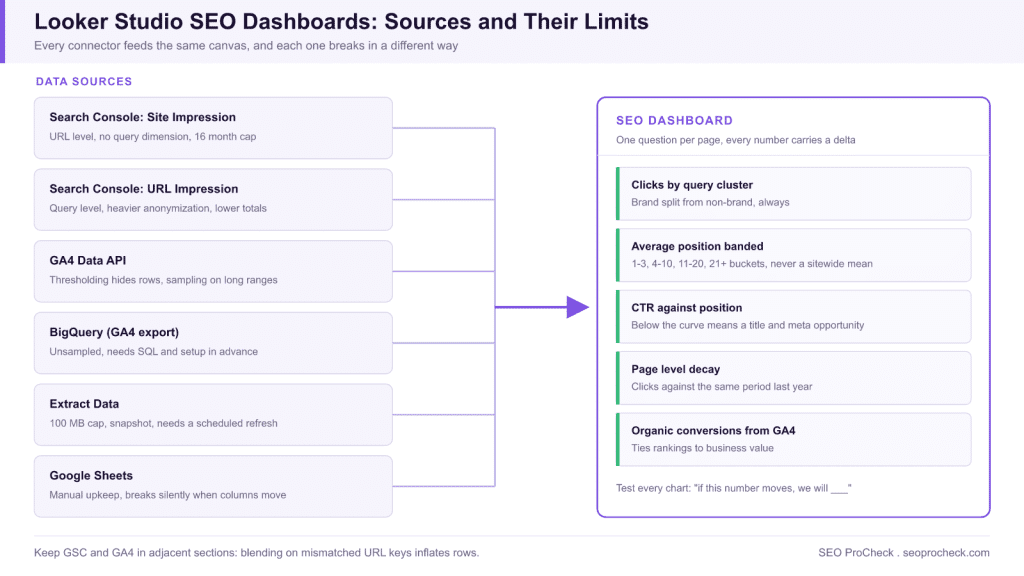
Most SEO reports get opened once, glanced at, and abandoned. The problem is rarely the data connector or the chart styling, it's that the dashboard answers no question anyone was actually asking. A report that blends Google Search Console (GSC) and GA4 well becomes a weekly decision tool; one that dumps every available metric becomes wallpaper. This guide covers how to build the former without falling into the sampling, blending, and vanity-metric traps that kill the rest.
Start with the decision, not the data source
Before you connect anything, write down the three to five decisions this report should drive. A dashboard exists to change behavior, to tell a client whether to keep investing in a content cluster, to tell an editor which pages to refresh, to tell a developer which templates are leaking impressions. If a metric on the canvas doesn't feed one of those decisions, it's decoration.
A practical test: for every chart, finish the sentence "If this number moves, we will ___." If you can't, cut it. Session duration with no follow-on action is the classic offender. So is a giant scorecard of total clicks that nobody can act on because it isn't segmented.
Wire GSC and GA4 in correctly
Looker Studio has native connectors for both, but their defaults will quietly mislead you.
- Search Console has two connector "tables": Site Impression (URL-level, no query dimension) and URL Impression (query-level). They report slightly different totals because of how Google aggregates anonymized queries. Pick deliberately, use Site Impression for page performance and Site Impression/URL Impression for query analysis, and never put them in the same chart expecting the numbers to reconcile.
- GA4's connector samples and thresholds. When you apply Google Signals, GA4 introduces data thresholding that hides rows for privacy, so your organic-session totals can shrink unpredictably. In your GA4 property, set Reporting Identity to
Device-basedfor analysis properties feeding dashboards, and be aware the API still samples high-cardinality queries over long date ranges. - Use the GA4 Data API connector, not a legacy UA mindset. Define organic traffic explicitly with a filter on
sessionDefaultChannelGroup = Organic Searchrather than trusting an unfiltered "Sessions" metric that includes paid, direct, and referral.
Connector reference: what each source gives you, and where it breaks
| Connector | Data it exposes | Key limitations |
|---|---|---|
| Search Console: Site Impression table | URL-level clicks, impressions, CTR, average position | No query dimension; 16-month history cap; ~2-day data lag; totals differ from URL Impression |
| Search Console: URL Impression table | Query + URL level data | Heavier anonymized-query filtering, so totals run lower than Site Impression; same 16-month cap |
| Google Analytics (GA4 Data API) | Sessions, engagement, key events, landing pages | Thresholding hides rows when Google Signals is on; per-property API quotas can break busy shared reports; sampling on high-cardinality long ranges |
| BigQuery (GA4 export) | Unsampled, row-level event data | Requires SQL and the export enabled in advance; daily tables land with a lag; query costs on large scans |
| Extract Data | Snapshot of any other source, held in memory | 100 MB per extract; not live, needs a scheduled refresh; loses fields you did not include in the extract |
| Google Sheets | Anything you can script or paste, e.g. rank-tracker exports | Manual upkeep or Apps Script required; slow on large sheets; silent breakage when columns move |
The 16-month Search Console cap deserves special attention: the connector can only reach as far back as GSC itself stores. If year-over-year reporting matters, start archiving now, either schedule Extract Data snapshots you append to a Sheet, or enable the GSC bulk data export to BigQuery, which accumulates history from the day you turn it on.
The blending trap, and when to avoid it
The instinct is to blend GSC and GA4 on the landing-page URL so you can show impressions, clicks, sessions, and conversions in one table. This breaks more often than it works, for reasons worth understanding:
- The join keys don't match. GSC reports the full URL including
https://and trailing slashes; GA4'slandingPagePlusQueryStringreports a path, often with query parameters attached. A naive blend on these fields matches almost nothing. - Left-join cardinality explodes. Looker Studio blends are left outer joins. If your right table has multiple rows per key (GA4 splitting a page by query string), metrics from the left table get duplicated across every match, inflating impressions and clicks.
- Date granularity must agree. Blend on
Dateonly when both sources are at the same grain, or your row counts multiply.
If you must blend, normalize the key first with a calculated field in each source so they produce identical strings:
REGEXP_REPLACE(Landing Page, '^https?://[^/]+', '') on the GSC side to strip the domain, and REGEXP_REPLACE(landingPagePlusQueryString, '\?.*', '') on the GA4 side to strip query strings. Then blend on the normalized path. Honestly, for most reporting you're better off not blending: put GSC and GA4 in adjacent, separately-scoped sections. Search behavior (impressions, position, CTR) and on-site behavior (sessions, conversions) answer different questions and rarely need to live in the same row.
Control sampling and freshness before you trust a chart
- Extract Data for stable, heavy reports. Looker Studio's Extract Data connector snapshots a query into an in-memory dataset, eliminating live-query sampling and dramatically speeding load. Schedule a daily refresh. Use it for any report that aggregates long date ranges across many pages.
- Show the data window. GSC data lags ~2 days and finalizes over ~3 days. Add a text note or a "data through" date field so nobody panics over an apparent drop that's just incomplete recent data.
- Set a sensible default date range. Last 28 days compared to previous period is a good default for trend work; avoid "this year" defaults that pull huge samples on every load.
Metrics that earn their place
Replace vanity totals with metrics that map to action. A strong organic dashboard usually centers on:
- Clicks and impressions by query cluster, not just sitewide totals, grouped with a CASE field so "brand" vs "non-brand" is separated. Brand traffic masks the SEO signal; always split it.
- Average position banded into buckets (1-3, 4-10, 11-20, 21+) using a calculated field. Striking-distance queries in the 11-20 band are your highest-leverage refresh targets.
- CTR vs. position, with an expected-CTR comparison. Pages ranking well with below-curve CTR signal a title/meta opportunity, a concrete editorial task.
- Page-level decay: clicks this period vs. the same period last year, sorted ascending. This is the single most actionable view for a content team.
- Organic conversions or key events from GA4, tied to landing pages, the only metric that connects rankings to business value.
A useful brand/non-brand calculated field:
CASE WHEN REGEXP_MATCH(Query, '(?i).*yourbrand.*') THEN "Brand" ELSE "Non-brand" END
And a striking-distance flag:
CASE WHEN Average Position > 10 AND Average Position <= 20 THEN "Striking distance" ELSE "Other" END
Design for the person reading it
- One screen, one question per page. Use Looker Studio's multi-page structure: page 1 executive summary, page 2 query opportunities, page 3 page decay, page 4 technical/indexing. Don't make people scroll a wall.
- Default to comparison. Enable period-over-period comparison on scorecards so every headline number carries a delta. A number without context is ignored.
- Add controls, not clutter. A date-range control, a brand/non-brand filter, and a page-path search box let a stakeholder self-serve the three questions they'll actually ask.
- Annotate. Use text boxes to state what "good" looks like and what action a chart implies. The dashboard should teach, not just display.
Common mistakes
- Blending GSC clicks with GA4 sessions and calling them the same thing. They measure different events at different points; they will never match and shouldn't be summed.
- Leaving brand queries in aggregate trend lines, which makes a flat or declining SEO program look healthy.
- Using live connectors on huge date ranges, then blaming Looker Studio for slow, sampled, timing-out reports, Extract Data solves this.
- Reporting position as a sitewide average. It's a near-meaningless blend of thousands of queries; band it or report it per query cluster.
- No "data freshness" note, leading to recurring false alarms over incomplete recent days.
FAQ
Should I use the GA4 connector or BigQuery? For most sites the native GA4 connector with Extract Data is enough. Move to the GA4 BigQuery export when you need unsampled, row-level data, custom attribution, or joins GA4's API can't express.
Why don't my GSC totals match the Search Console UI? Usually because you're using the URL Impression table (query-level, more anonymization) versus Site Impression, or your date range includes unfinalized recent days. Match the table and the window before assuming the connector is wrong.
How often should it refresh? Daily is plenty for SEO; the underlying data doesn't change faster than that. Schedule extracts overnight so morning loads are instant.
How do I get more than 16 months of Search Console data in Looker Studio? You cannot, retroactively: the API only serves what GSC stores. Going forward, enable the GSC bulk data export to BigQuery or schedule periodic Extract Data snapshots appended to a Google Sheet. Either way, the archive only contains data from the day you start it, so set it up before you need it.
Why is my Looker Studio report so slow? Almost always live connectors over long date ranges, plus blends. Every chart fires its own query on page load, and a blend fires one per source. Convert heavy sources to Extract Data with an overnight refresh, cut charts per page, and shorten the default date range; a page that loaded in 40 seconds routinely drops under 5.
How do I share a dashboard with a client without giving them GA4 access? Set each data source's credentials to Owner's credentials instead of Viewer's credentials (edit the data source, top toolbar). Viewers then see the data through your access and need no permissions on the GA4 property or GSC site. Just remember this means anyone with report access sees the data, so share the report itself deliberately.
Want this handled properly on your site?
It is exactly the kind of work an advanced technical SEO audit covers. See how an advanced SEO audit works →
Take this with you
The assistant links open with a question about this page already written. Nothing is sent until you press enter.
Claude Vincent is a technical SEO consultant focused on crawlability, rendering, and AI-search visibility. He writes the field guides and case studies at SEO ProCheck, with a bias toward the durable, unglamorous work that decides whether search engines and AI answer engines can actually read and cite a site.
About SEO ProCheck
Technical SEO consulting and GEO strategy with 20 years of enterprise experience. Case studies, resources, and tools for search and AI visibility.
Work With Me
Technical SEO audits, GEO strategy, site migrations, and international SEO. Hourly consulting for teams who need hands-on support, not just reports.
Subscribe to our newsletter!








Recent Posts
- Most Top Sites Never Say Who They Are in Structured Data October 14, 2026
- Homepage Titles Are Mostly Too Short, Not Too Long October 8, 2026
- Who Actually Serves an llms.txt? 184 Top Sites Measured September 29, 2026