

How to Increase Website Traffic by 250k+ Monthly Visits - Siege Media
- November 4, 2022
- Growth
AI Summary
A traffic target is only a plan once it is converted into impressions, queries, URLs and a publishing rate. Working backwards from the number turns a vague growth goal into a set of assumptions you can test each month and correct early.
- State the goal in clicks, not sessions, so the number of record matches the report you will use to track it.
- Convert clicks to impressions using your own blended CTR from Search Console, never a published CTR curve.
- Impressions move months before clicks. Track the impression line to know if the plan is working before traffic shows it.
- If clicks per indexed URL is falling, publishing more will not help. Consolidate and refresh first.
Case study overview
This case study documents a successful organic growth strategy, demonstrating how strategic SEO implementation drives measurable business results. The approach provides actionable insights for practitioners facing similar challenges.
Challenge and Context
Every successful SEO initiative begins with understanding the starting position and objectives. This case study reveals the initial challenges, competitive landscape, and business goals that shaped the strategy. Understanding context helps practitioners assess applicability to their own situations.
Strategic Approach
The methodology employed combined technical optimization, content strategy, and authority building in a coordinated approach. Key decisions around prioritization, resource allocation, and tactical execution provide a template for similar initiatives. The strategy balanced quick wins with sustainable long-term growth.
Implementation Details
Moving from strategy to execution required specific technical implementations, content creation processes, and measurement frameworks. This case study documents the practical steps taken, tools used, and workflows developed. These implementation details help practitioners translate strategy into action.
Results and Analysis
The outcomes demonstrate the effectiveness of the approach through measurable metrics: traffic growth, ranking improvements, and business impact. Analysis of what worked best and what could have been done differently provides learning value beyond the raw results.
This case study contributes to the evidence base for effective SEO strategy, helping practitioners learn from documented successes.
Turn the goal into a model before you turn it into a calendar
Most traffic goals fail at the arithmetic stage, long before execution. Someone sets a number, the team starts publishing, and nobody checks whether the target was reachable with the keyword demand available in that market. Twelve months later the deficit is obvious and the diagnosis is wrong, because the effort was real and the plan was never testable.
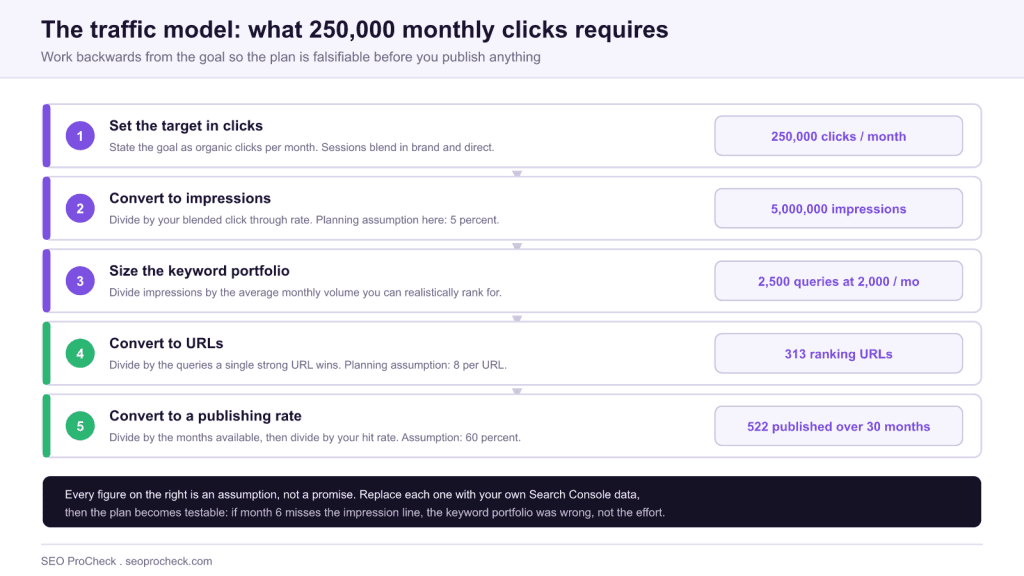
The fix is a five step conversion, shown in the diagram above, that turns a click goal into a publishing rate. Every step is a division, and every step carries an assumption you should write down. The point is not that the model predicts the future accurately. It will not. The point is that a wrong assumption becomes visible in month four instead of month eighteen.
The model, step by step
| Step | Calculation | Worked example | Where your real number comes from |
|---|---|---|---|
| 1. Target | Stated as organic clicks per month | 250,000 clicks per month | The business goal, converted from revenue if you have a value per session |
| 2. Impressions required | clicks divided by blended CTR | 250,000 / 0.05 = 5,000,000 | Search Console Performance, site wide CTR filtered to non brand queries |
| 3. Keyword portfolio | impressions divided by average monthly volume per winnable query | 5,000,000 / 2,000 = 2,500 queries | Keyword tool volume for the terms you can actually reach, not the head terms |
| 4. URLs required | queries divided by queries won per URL | 2,500 / 8 = 313 URLs | Search Console export: distinct queries divided by pages with impressions |
| 5. Publishing rate | URLs divided by hit rate, then divided by months | 313 / 0.6 = 522, over 30 months = about 17 per month | Your historical share of published URLs that reached page one within 12 months |
Why clicks, not sessions
Search Console counts clicks at the search engine. GA4 counts sessions in the browser, after consent banners, ad blockers and cross domain attribution have had their say. The two numbers will never reconcile, and a target defined in sessions is measured in a system that is influenced by things outside SEO. Set the goal in clicks, track it in the Performance report, and use GA4 for what it is good at, which is what happens after the click.
If you need both views joined up for reporting, the practical setup is covered in connecting GA4 and Search Console for full funnel SEO.
Getting your own CTR number
Open Search Console, Performance, Search results. Add a query filter excluding your brand terms, set the date range to the last 6 months, and read the site wide CTR. That is your planning figure. It already accounts for the SERP features, the query mix and the snippet quality of your actual site, which no published curve can do.
Two adjustments are worth making. First, segment by page type if your site has very different templates, because a product page and a guide will not share a CTR. Second, if a large share of your impressions come from queries you rank badly for, your blended rate will understate what you would earn from the queries you are targeting. Filter to positions 1 to 10 for a more useful planning number.
Sizing the keyword portfolio honestly
The step that breaks most plans is step 3. It is tempting to fill the portfolio with the highest volume terms in the market, which produces a small, clean spreadsheet and an unreachable plan. The realistic input is the set of queries where your domain can compete inside the planning horizon.
A quick way to find that boundary: export your Search Console queries for the last 3 months, filter to positions 5 to 20, and look at the difficulty band those terms sit in. That band is roughly what you can win now. Terms far above it require authority you do not yet have, and belong in a later phase of the plan rather than in the first year's portfolio.
The mechanics of building that list from scratch are in keyword research fundamentals.
Reading the monthly signal
Once the model exists, the monthly review becomes short. You compare actual impressions against the impression line implied by the model, then diagnose any gap. Impressions are the leading indicator because a page starts collecting them as soon as it enters the index, often months before it climbs high enough to earn clicks.
| What you see in Search Console | Most likely cause | The lever that actually moves it |
|---|---|---|
| Impressions rising, clicks flat | You are ranking, but not in a position or format that earns the click, or a SERP feature is absorbing it | Title and description rewrite, add the direct answer near the top, target the feature format |
| Impressions flat, position improving | You are climbing inside a query set that is too small to matter | Expand the portfolio. The current cluster has hit its ceiling |
| Impressions falling, position flat | The query set shrank, seasonality, or an AI surface is answering upstream of you | Check the Queries tab for lost terms. Add coverage for the questions being answered without you |
| Clicks rising, conversions flat | The portfolio is weighted to informational intent | Rebalance toward comparison, alternatives and pricing queries |
| Pages with impressions rising, clicks per URL falling | Library dilution: more URLs sharing the same demand | Consolidate overlapping pages before publishing anything new |
The row that catches teams off guard is the last one. A library can add URLs, add impressions and still lose clicks per URL, which means the new pages are competing for demand the old pages already served. That is dilution, and the correct response is consolidation, not acceleration.
Where the traffic actually comes from
A target of this size is never met by one tactic. In practice it decomposes into four sources, and it is worth forecasting each separately because they have very different lead times:
| Source | Typical lead time | What it depends on | Ceiling |
|---|---|---|---|
| New pages against unserved demand | 6 to 12 months per cohort | Publishing rate and topical coverage | The size of the addressable query set |
| Improving existing page one rankings | 1 to 3 months | On page work and internal links | Limited but the fastest return available |
| Recovering decayed pages | 1 to 2 months | A working refresh loop | Proportional to how neglected the library is |
| Winning SERP features and rich results | 1 to 4 months | Structured data and answer formatting | Query dependent, often underrated |
Teams overweight the first row and ignore the second and third, which is backwards for the first year. Improving pages that already sit in positions 5 to 15 is the cheapest traffic on the table, because the page is already indexed, already linked and already trusted enough to rank. The compounding growth comes later, from the first row.
Internal links are the multiplier across all four. A page cannot climb from position 12 to position 4 while it carries two inbound links from a tag archive. The systematic approach is in the internal linking complete guide, and the decay recovery loop is in the content audit process.
The failure modes to plan around
- Forecasting from someone else's case study. Growth curves are a function of domain history, market competition and funding. A number achieved by another site is not a target, it is an anecdote.
- Confusing publishing with progress. Published URLs are an input. Indexed URLs earning impressions are the first real output. Track both, and stop publishing if the gap widens.
- Setting the goal on total sessions. Brand and direct traffic will flatter the number and hide the fact that non brand organic is flat.
- Ignoring the hit rate. Not every page ranks. If you plan 313 URLs and your historical hit rate is 60 percent, you need to publish over 500 or the plan is short by 40 percent before it starts.
- Reviewing quarterly instead of monthly. The whole value of the model is early correction. A quarterly cadence gives you four chances to notice a problem in a two year plan.
FAQ
For most sites the honest answer is two to three years, and it depends far more on domain strength than on effort. A site that already ranks for hundreds of queries can add that volume by expanding an existing cluster, while a new domain has to build authority first and will see almost nothing for the first two quarters. The useful planning move is to convert the target into a monthly impression line and check progress against that, because impressions move months before clicks do.
Neither as a rule. Target the queries where your current authority can realistically compete, which you find by looking at what already ranks in positions 5 to 20 for your domain. Long tail is not a strategy in itself, it is what you can win early; head terms become reachable once the surrounding cluster ranks.
Use your own blended rate from Search Console rather than a published curve, because CTR varies enormously by query type, brand presence and SERP features. Open Performance, look at the site wide CTR for non brand queries, and use that as your planning figure. If you must start somewhere before you have data, run the model at both a pessimistic and an optimistic rate and plan against the pessimistic one.
A well built page targeting a topic rather than a single string will usually accumulate a spread of related queries over time, and you can measure your own average by dividing distinct queries by ranking pages in a Search Console export. Use your measured number in the model, not a number from a case study, because it varies by vertical and by how broadly your templates are written.
No, and past a few hundred URLs it is often the wrong lever. Check clicks per indexed URL first. If that number is falling, the library already has more pages than it can support, and consolidating or refreshing existing URLs will return faster than publishing new ones.
Search Console reports clicks, GA4 reports sessions, and the two never match because of consent, filtering and attribution differences. Pick one as the number of record before you set a goal. Clicks are the cleaner planning unit for organic work because they are measured at the search engine rather than in the browser.
Want to know if your traffic target is actually reachable?
An audit sizes the addressable demand for your domain, measures your real CTR and hit rate, and rebuilds the forecast on your own numbers.
Source: https://www.siegemedia.com/strategy/increase-website-traffic
Take this with you
The assistant links open with a question about this page already written. Nothing is sent until you press enter.
Claude Vincent is a technical SEO consultant focused on crawlability, rendering, and AI-search visibility. He writes the field guides and case studies at SEO ProCheck, with a bias toward the durable, unglamorous work that decides whether search engines and AI answer engines can actually read and cite a site.
About SEO ProCheck
Technical SEO consulting and GEO strategy with 20 years of enterprise experience. Case studies, resources, and tools for search and AI visibility.
Work With Me
Technical SEO audits, GEO strategy, site migrations, and international SEO. Hourly consulting for teams who need hands-on support, not just reports.
Subscribe to our newsletter!








Recent Posts
- Most Top Sites Never Say Who They Are in Structured Data October 14, 2026
- Homepage Titles Are Mostly Too Short, Not Too Long October 8, 2026
- Who Actually Serves an llms.txt? 184 Top Sites Measured September 29, 2026