

AI Summary
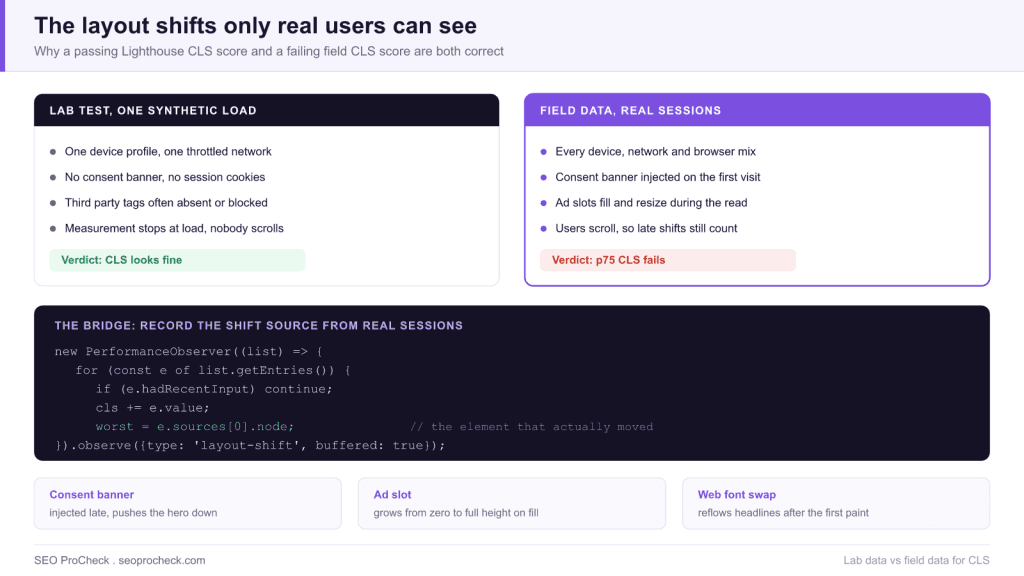
Part two of the BuzzFeed layout shift work turns to real user data, because a synthetic Lighthouse run cannot reproduce the consent banner, the ad fill or the late font swap that actually move a reader's page. The fix is to instrument PerformanceObserver for layout-shift entries, record the element that moved, and rank the offenders by how much of your p75 CLS they own.
- Core Web Vitals are judged at the 75th percentile of real sessions over a rolling 28 day window, so a fast median hides a failing score.
- CLS is a sum of session windows, not a single number: the largest burst of shifts within a 5 second window, with gaps of 1 second or more starting a new window.
- Shifts within 500ms of a user interaction are excluded via
hadRecentInput, so scroll and click driven movement is not penalised. - The useful field payload is not the score, it is
sources[0].node: the DOM element that moved.

The most frustrating stage of a Cumulative Layout Shift project is the one where the lab says you passed and the field says you failed. Both readings are honest. A synthetic test loads one page, one time, on one device profile, with no consent state, often with third party tags stripped, and it stops measuring the moment the load finishes. Real readers arrive with cold caches on slow networks, see a consent banner, scroll into ad slots that expand as they fill, and stay on the page long enough for every late arriving element to push content around.
This second BuzzFeed instalment is about closing that gap by asking the people who actually experience the shifts. Below is the practitioner version: how CLS is calculated, what to instrument, where the data lands in Google's reports, and how to turn a field score into a ranked list of elements to fix. If you have not read the diagnosis phase, start with part one on improving CLS at BuzzFeed.
What the CLS number is actually made of
CLS is not a count of shifts and it is not a pixel distance. Each unexpected shift produces a layout shift score of impact fraction multiplied by distance fraction. The impact fraction is the share of the viewport that unstable elements occupied across the before and after frames. The distance fraction is the greatest distance any unstable element moved, divided by the viewport's largest dimension. A banner that occupies half the viewport and shoves everything down by a quarter of the screen height therefore scores far worse than a small caption nudging sideways.
Those individual scores are grouped into session windows. A window opens at the first shift, extends while shifts keep occurring, closes after a gap of 1 second with no shift, and can never exceed 5 seconds in total. The page's reported CLS is the value of the largest window, not the sum of every shift on the page. This is what makes an infinite scroll feed survivable: a steady drip of small shifts across a long session does not compound into one enormous score.
| Concept | Rule | Why it matters in the field |
|---|---|---|
| Good threshold | CLS of 0.1 or less | One full width banner insert can exceed this on its own |
| Poor threshold | Above 0.25 | Search Console groups these URLs as failing in the CWV report |
| Percentile | 75th percentile of page loads | The slowest quarter of your audience decides the verdict |
| Window | Rolling 28 days of real traffic | A deployed fix takes weeks to fully move the reported number |
| Session window | Max 5s, closed by a 1s gap | Clustered shifts hurt far more than spaced out ones |
| Input exclusion | Shifts within 500ms of an interaction are ignored | Accordion and menu expansions are not counted against you |
Instrumenting real sessions
The browser will tell you exactly which element moved, but only if you ask while the user is on the page. The raw API is PerformanceObserver with {type: 'layout-shift', buffered: true}. Each entry carries value, hadRecentInput, startTime and a sources array whose first item points at the DOM node that moved. That node is the entire point of field instrumentation. A score tells you that you have a problem; the node tells you which template, component or ad slot to fix on Monday.
Three implementation details separate data you can act on from data you cannot:
- Do not report at load. CLS accumulates for the life of the page. Flush the metric on
visibilitychangewhen the state becomeshidden, and send it withnavigator.sendBeacon()so the request survives the page going away. Reporting atloadsystematically undercounts every shift that happens during the read. - Send a selector, not a node. Convert
sources[0].nodeinto a stable CSS selector or a component name before it leaves the browser, otherwise the payload is unusable in aggregate. - Segment on arrival. Record device type, connection type, whether the consent banner was shown, and which experiment variant the user got. Field CLS problems are almost always concentrated in one segment, and an unsegmented average hides that.
Google's own web-vitals JavaScript library ships an attribution build that does most of this for you: onCLS() returns an attribution object containing largestShiftTarget, largestShiftTime, largestShiftValue and the loadState at the moment of the worst shift. That last field is the tiebreaker in most investigations, because it separates shifts that happen while the DOM is still loading from shifts caused by something injected long after.
Where the field data already exists
| Source | Where to find it | Granularity | Limitation |
|---|---|---|---|
| Search Console | Experience, Core Web Vitals, Mobile | URL groups sharing a template | No element attribution, lags real time |
| PageSpeed Insights | Top panel, Discover what your real users are experiencing | Single URL plus origin rollup | Only URLs with enough CrUX traffic |
| CrUX BigQuery | The public chrome ux report dataset | Origin level, monthly, by device | Origin only, no page level detail |
| Your own RUM | PerformanceObserver plus a beacon endpoint | Per session, per element, per segment | You have to build and maintain it |
The practical workflow is to let Search Console tell you which template group fails, use PageSpeed Insights to confirm the p75 on a representative URL, and then use your own instrumentation to name the element. The background on CrUX explains why the reported number moves slowly even after a good deploy.
Technical Challenge
Technical SEO issues often create invisible barriers to ranking potential. This case study identifies the specific technical challenges addressed, from crawlability issues to performance bottlenecks. Understanding the problem scope helps practitioners diagnose similar issues.
The barrier here is measurement, not code. Layout shift is the one Core Web Vital where the lab environment systematically differs from the real one, because the biggest offenders are exactly the things a synthetic test suppresses: consent management platforms, ad tags, personalisation, and A/B test containers that render after the first paint. A team can pass every local test, ship confidently, and still fail the field assessment for months.
Diagnostic Process
Identifying technical issues requires systematic analysis using crawling tools, log file analysis, and Search Console data. This case study documents the diagnostic methodology that uncovered actionable issues. The process itself provides value for practitioners building technical audit capabilities.
For CLS the diagnostic order runs from broad to specific. Start in Search Console to find failing URL groups, since it clusters URLs that share a template and tells you the scale of the problem. Reproduce with a throttled load in Chrome DevTools, enabling Layout Shift Regions in the Rendering drawer so shifted areas flash on screen, and read the Experience section of a Performance trace to see each shift with its score and the element that moved. Then confirm with field data, because the reproduction only proves the shift is possible, not that it is what your audience gets.
Implementation and Solutions
Each identified issue required specific technical solutions implemented within development constraints. The case study details solutions for rendering issues, performance optimization, crawl management, and indexation improvements. Implementation approaches balance ideal solutions with practical constraints.
Nearly every real fix is a variation on one idea: reserve the space before the content arrives.
| Shift source | What real users see | Fix |
|---|---|---|
| Images without dimensions | Text jumps down as each image decodes | Set width and height attributes, or a CSS aspect-ratio |
| Ad slots | Container grows from zero when the creative fills | Reserve the largest size the slot can serve with min-height |
| Consent banner | Whole page pushed down on first visit | Overlay it with position: fixed instead of inserting into flow |
| Web fonts | Headlines reflow when the custom font swaps in | Preload the font, use font-display: optional, match fallback metrics |
| Embeds and iframes | Video or social embed resizes after script load | Wrap in a fixed aspect ratio container |
| Late injected banners | Newsletter or app promo appears above the fold | Render server side, or reserve the slot in the initial HTML |
The constraint most teams hit is revenue: an ad slot that reserves its largest possible size costs viewable area when it serves a smaller creative. The workable compromise is to reserve the size that slot actually serves at the 75th percentile, measured from your own ad server reports rather than the rate card. Our guide on what to do when CLS is too high covers the template level version of that decision.
Measurable Impact
Technical improvements demonstrate value through measurable outcomes: improved crawl stats, faster indexation, better Core Web Vitals scores, and ultimately improved rankings and traffic. This case study quantifies the impact of technical optimization.
Measure the fix in two layers. Your own RUM shows the change within hours, because it reports on live sessions: the p75 for the affected template should drop immediately and the offending selector should fall out of the top shift sources. Search Console and CrUX move much more slowly, because both report a rolling 28 day window, so a URL group that fails today typically needs a full 28 days after the deploy before the reported status can turn green, and Search Console then needs its own validation pass on top. Set that expectation with stakeholders before the fix ships, or the first weekly report will read as a failure.
Technical SEO case studies like this one help practitioners understand the tangible value of investing in site infrastructure.
This technical SEO case study demonstrates how resolving technical issues and optimizing site infrastructure directly impacts organic visibility. The documented approach provides a template for technical optimization initiatives.
FAQ
A CLS of 0.1 or less at the 75th percentile is the good threshold, anything above 0.25 is classed as poor, and the band between the two is needs improvement. The assessment uses real user data over a rolling 28 day window, so the score reflects your slowest quarter of visitors rather than an average.
Lighthouse runs one synthetic load with no consent state, often without third party tags, and stops measuring at load. Search Console reports real sessions that include the consent banner, ad fills, personalisation and everything that shifts while the reader scrolls. Both numbers are accurate for what they measure.
Observe layout-shift entries with PerformanceObserver and read the sources array on each entry: the first source points at the DOM node that moved. Convert that node to a stable selector and send it with the metric, or use the attribution build of the web-vitals library, which exposes largestShiftTarget directly.
Yes. CLS measures the whole lifespan of the page, so a shift triggered by an ad refresh or a late banner ten seconds into the read still counts. This is why the metric must be reported on visibilitychange rather than at load, otherwise you systematically undercount.
No. Any shift that begins within 500 milliseconds of a user interaction is flagged with hadRecentInput and excluded. Expanding an accordion, opening a menu or submitting a form is expected movement, so it is not penalised.
Field reporting uses a rolling 28 day window, so the reported score only fully reflects a fix roughly 28 days after it reaches all users, and Search Console adds its own validation step after that. Your own real user monitoring will show the improvement within hours, which is why it is worth instrumenting.
Source: https://tech.buzzfeed.com/improving-cumulative-layout-shift-at-buzzfeed-part-2-2a846adeb097
Take this with you
The assistant links open with a question about this page already written. Nothing is sent until you press enter.
Claude Vincent is a technical SEO consultant focused on crawlability, rendering, and AI-search visibility. He writes the field guides and case studies at SEO ProCheck, with a bias toward the durable, unglamorous work that decides whether search engines and AI answer engines can actually read and cite a site.
About SEO ProCheck
Technical SEO consulting and GEO strategy with 20 years of enterprise experience. Case studies, resources, and tools for search and AI visibility.
Work With Me
Technical SEO audits, GEO strategy, site migrations, and international SEO. Hourly consulting for teams who need hands-on support, not just reports.
Subscribe to our newsletter!








Recent Posts
- Most Top Sites Never Say Who They Are in Structured Data October 14, 2026
- Homepage Titles Are Mostly Too Short, Not Too Long October 8, 2026
- Who Actually Serves an llms.txt? 184 Top Sites Measured September 29, 2026