

AI Summary
SEO forecasting predicts future organic clicks and conversions from historical data using three main methods: run rate extrapolation, time series decomposition, and a bottom up keyword model. The right method depends on how stable your site is and whether you are projecting existing pages or new ones, and every forecast should be a range with a confidence band rather than a single number.
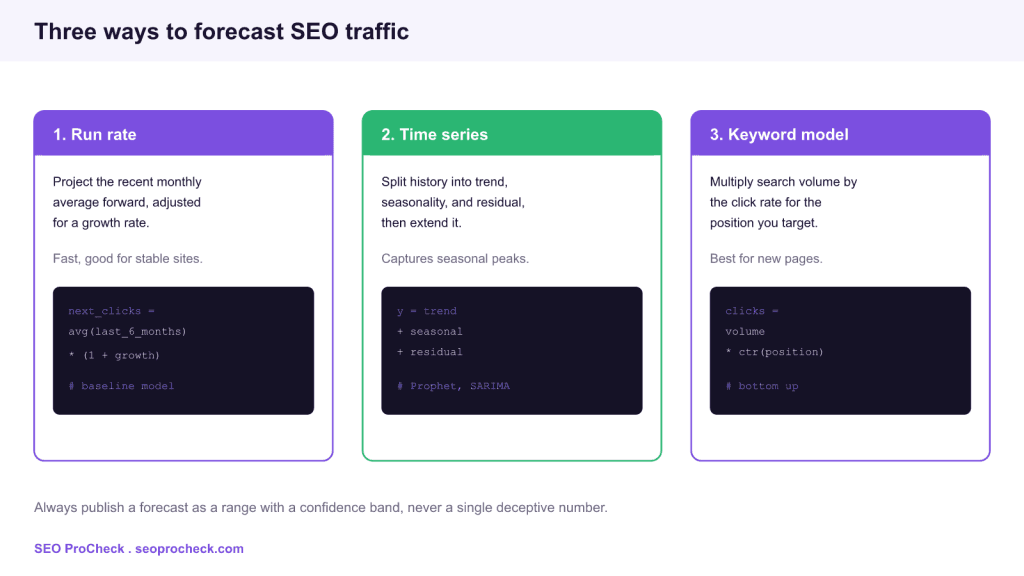
- Run rate extends your recent monthly average forward, adjusted for a growth rate, and is the fastest baseline.
- Time series models like Prophet and SARIMA split history into trend, seasonality, and residual, so they capture seasonal peaks.
- The keyword model multiplies search volume by the click through rate for the position you target, ideal for new pages with no history.
- Report forecasts as a low, expected, and high scenario, and always state the assumptions behind them.
SEO forecasting is the practice of estimating future organic search performance, usually clicks, sessions, or conversions, from data you already have. Done well, it turns SEO from a promise into a plan: it sets targets, justifies budget, and flags when results drift away from expectation. Done badly, it produces a single confident number that reality never matches. This guide covers the three forecasting methods practitioners actually use, when each fits, and how to present a forecast that survives contact with a finance team.
Start with clean historical data
Every forecast is only as good as its inputs. Pull at least 12 months of history, and 24 if you have it, so a seasonal cycle is visible. Clicks and impressions come from Search Console, sessions and conversions from GA4. Before modeling, remove obvious distortions: a migration, a tracking outage, a viral spike, or an algorithm hit will all skew a naive projection. If you script the export, an automated Search Console report gives you a clean, repeatable dataset to forecast from rather than a one off spreadsheet.
Method 1: run rate extrapolation
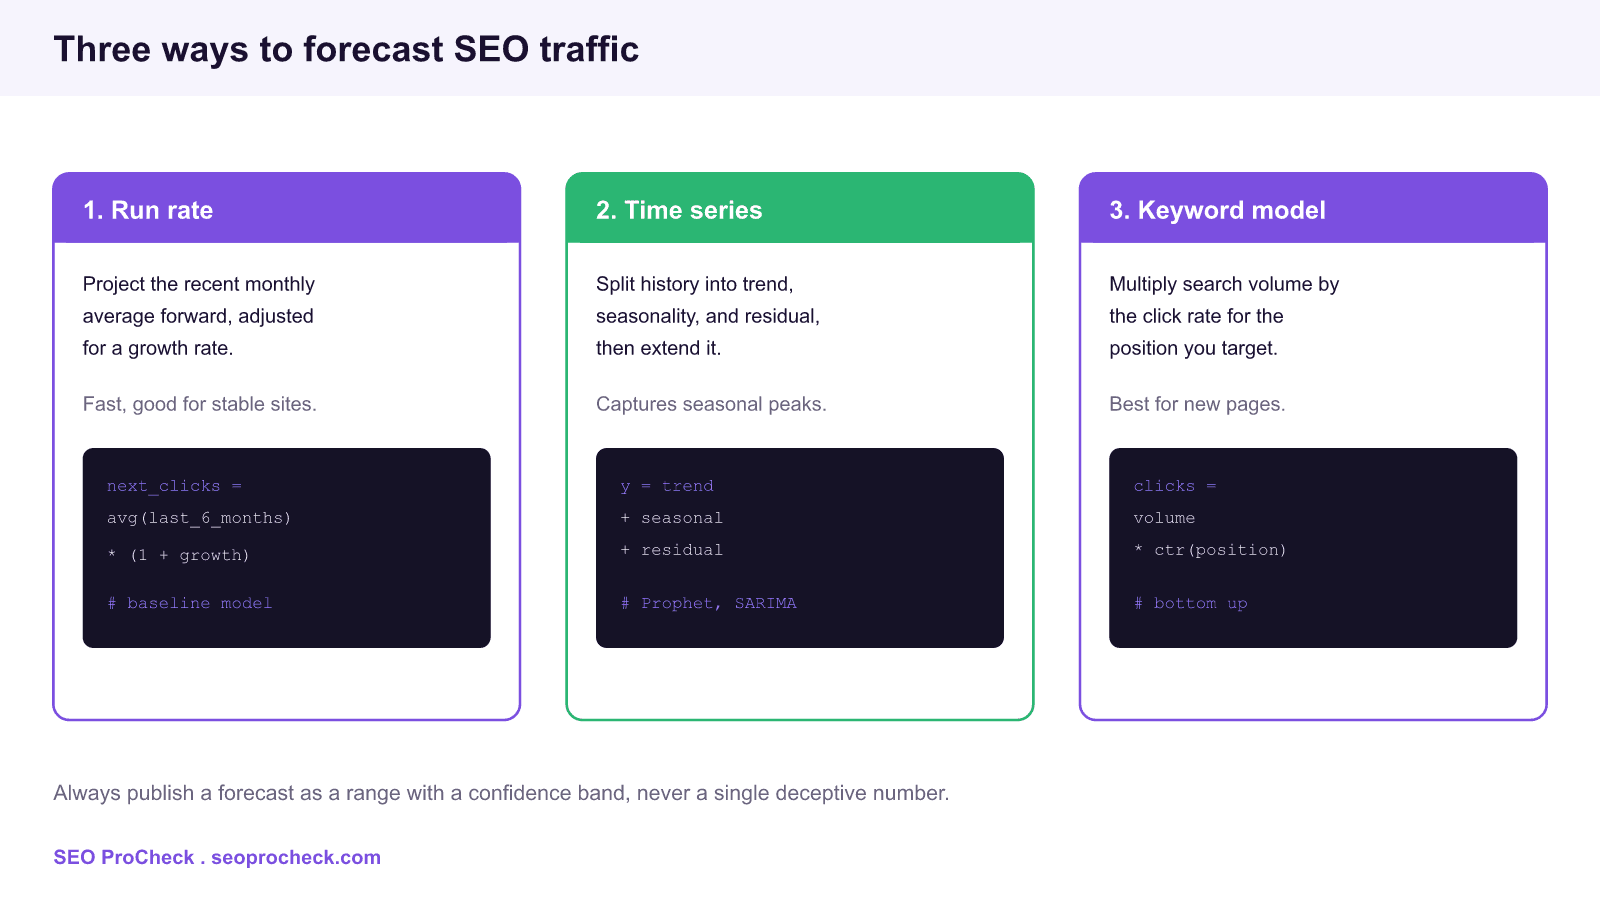
The simplest forecast projects your recent average forward. Take the average monthly clicks over the last six months, apply an expected growth rate, and extend the line. It is fast, transparent, and hard to argue with for a stable site. The formula is next_clicks = avg(last_6_months) * (1 + growth). Its weakness is that it ignores seasonality, so a run rate built in a quiet summer will underforecast a busy autumn. Use it as a baseline and a sanity check against more complex models, not as the final answer for a seasonal business.
Method 2: time series decomposition
Time series models treat traffic as a signal made of three parts: a long term trend, a repeating seasonal pattern, and residual noise. Tools like Prophet and SARIMA fit these components and project them forward, which means they handle the autumn peak and the December dip automatically. This is the most accurate approach for an established site with a clear seasonal rhythm. It needs enough clean history, at least two full cycles, and it will happily extend a decline as confidently as growth, so pair it with judgement about known future changes the model cannot see.
Method 3: the bottom up keyword model
When you forecast a page that does not exist yet, history cannot help. Instead you build the estimate from the keywords the page will target. Multiply the monthly search volume of each keyword by the expected click through rate for the position you realistically expect to reach: clicks = volume * ctr(position). Sum across keywords for a page or project total. The two assumptions that make or break this model are the target position and the CTR curve you apply, so state both explicitly. This method underpins most content and link building business cases because it ties a forecast directly to a keyword strategy.
| Method | Best for | Data needed | Main weakness |
|---|---|---|---|
| Run rate | Stable sites, quick baselines | 6 months of clicks | Ignores seasonality |
| Time series | Established, seasonal sites | 2 full years ideally | Cannot see future events |
| Keyword model | New pages and projects | Volumes and CTR curve | Sensitive to position guess |
The CTR curve is your biggest assumption
Both the keyword model and any position based scenario rely on a click through rate by position. There is no universal curve: CTR varies by intent, by SERP layout, and increasingly by whether an AI Overview sits above the results and absorbs the click. Rather than trusting a generic industry table, derive your own curve from Search Console by averaging CTR at each average position for your own queries. Your data reflects your brand strength and your SERPs, which makes every downstream forecast more defensible. This is also where forecasting connects to organic traffic attribution, because you need to know which clicks turned into value before a click forecast becomes a revenue forecast.
Present a range, never a point
The single most important habit in SEO forecasting is refusing to deliver one number. Publish three scenarios: a conservative low, an expected case, and an optimistic high, each with its assumptions written down. This does two things. It sets honest expectations with stakeholders, and it gives you a band to measure actuals against, so you learn whether your model runs hot or cold and can recalibrate. A forecast is a hypothesis, not a guarantee, and framing it as a range keeps it useful even when the middle estimate misses. Feed the same cleaned data into a custom GA4 dashboard so actuals sit next to the forecast and drift is obvious.
Frequently asked questions
How much historical data do I need to forecast SEO?
Aim for at least 12 months so one seasonal cycle is visible, and 24 months for time series models that separate trend from seasonality. With less than a year, a run rate or a bottom up keyword model is safer than a seasonal model.
Which forecasting method is most accurate?
For an established, seasonal site, time series decomposition with Prophet or SARIMA usually wins. For a brand new page with no history, only the bottom up keyword model applies. Run rate is the fastest baseline to check the others against.
How do AI Overviews affect SEO forecasts?
AI Overviews can reduce click through rate on informational queries even when rankings hold, so a forecast built on an old CTR curve may run high. Rebuild your CTR curve from recent Search Console data and treat affected query groups more conservatively.
What click through rate should I use in a keyword model?
Derive it from your own Search Console data by averaging CTR at each average position for your queries. A self measured curve reflects your intent mix and SERP features far better than a generic published table.
Why should a forecast be a range instead of one number?
Because SEO outcomes depend on factors you cannot fully control, from algorithm updates to competitor moves. A low, expected, and high scenario sets honest expectations and gives you a band to measure actual results against so you can recalibrate the model.
Take this with you
The assistant links open with a question about this page already written. Nothing is sent until you press enter.
Claude Vincent is a technical SEO consultant focused on crawlability, rendering, and AI-search visibility. He writes the field guides and case studies at SEO ProCheck, with a bias toward the durable, unglamorous work that decides whether search engines and AI answer engines can actually read and cite a site.
About SEO ProCheck
Technical SEO consulting and GEO strategy with 20 years of enterprise experience. Case studies, resources, and tools for search and AI visibility.
Work With Me
Technical SEO audits, GEO strategy, site migrations, and international SEO. Hourly consulting for teams who need hands-on support, not just reports.
Subscribe to our newsletter!








Recent Posts
- Most Top Sites Never Say Who They Are in Structured Data October 14, 2026
- Homepage Titles Are Mostly Too Short, Not Too Long October 8, 2026
- Who Actually Serves an llms.txt? 184 Top Sites Measured September 29, 2026