

AI Summary
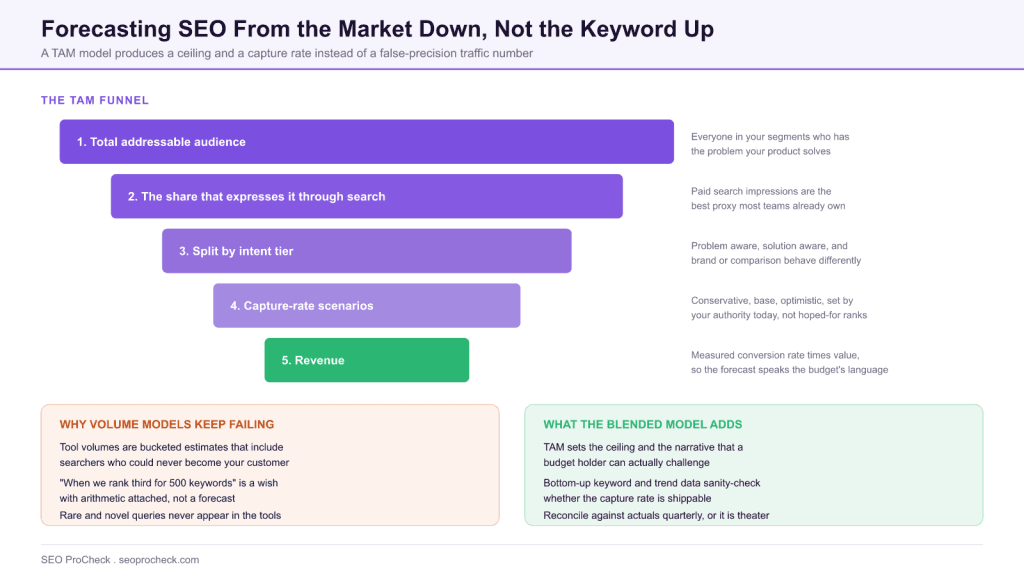
A TAM-based SEO forecast starts from the total population of people who could plausibly reach your product through search, then estimates what share of that demand your site can realistically capture at different levels of investment. It produces a ceiling and a capture rate instead of a false-precision monthly traffic number.
- Keyword volume models fail because tool volumes are bucketed estimates, assumed rankings are wishes, CTR curves are collapsing, and the long tail never appears in the tools at all.
- Build the model in five moves: size the audience, estimate the searching share, split by intent tier, apply capture-rate scenarios, convert to revenue.
- The forecast's value is the argument, not the number. Every input should be visible on the page and challengeable by whoever reads it.
- Reconcile against actuals quarterly. A forecast that is never checked against reality is theatre.
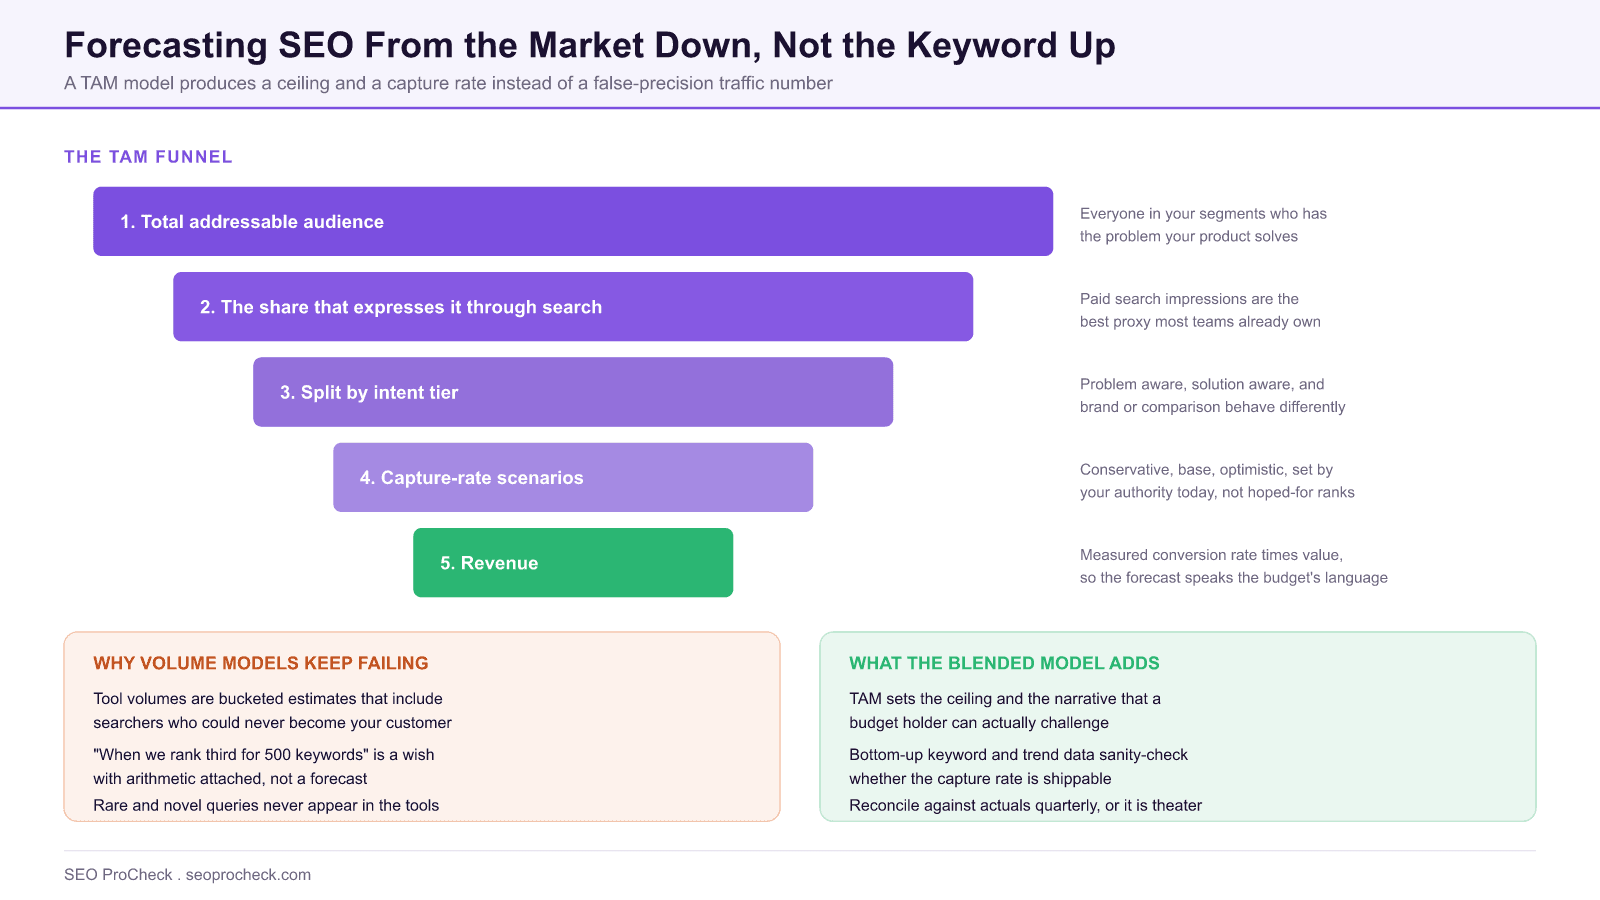
How do you forecast SEO with Total Addressable Market (TAM)? Instead of adding up keyword search volumes, a TAM-based SEO forecast starts from the total population of people who could plausibly reach your product through search, then estimates what share of that demand your site can realistically capture at different levels of investment. It produces a ceiling and a capture rate rather than a false-precision traffic number.
Forecasting SEO with Total Addressable Market (TAM) provides valuable insights for SEO practitioners. This resource examines approaches and considerations that can improve organic search performance.
About the source and the idea
The source below comes from the Product-Led SEO newsletter, written by Eli Schwartz, the consultant and author best known for arguing that SEO should be planned like a product investment rather than a keyword checklist. Applying TAM, a concept borrowed from venture and product strategy, to SEO forecasting is a natural extension of that thesis: before promising traffic, size the actual market of searchers, because no amount of optimization can capture demand that does not exist.
Why volume-based forecasts keep failing
The standard agency forecast multiplies keyword search volumes by an assumed ranking position and a click-through rate curve, then draws a hockey stick. It fails predictably, for reasons practitioners know but rarely price in:
- Search volume is not demand for you. Tool volumes are estimates, averaged and bucketed, and include searchers who could never become your customer (wrong country, wrong intent, job seekers, students).
- Position assumptions are fantasy. "When we rank #3 for these 500 keywords" is not a forecast; it is a wish with arithmetic attached.
- CTR curves are collapsing. Ads, SERP features, and AI answers absorb clicks before position one is ever reached, and the absorption rate differs wildly by query type.
- The long tail is invisible. A large share of real queries are rare or novel and never appear in keyword tools, so volume-based models systematically miss the demand that content actually captures.
A TAM framing attacks the problem from the top instead: how many people have the problem we solve, how many of them express it through search, and what share of those searches could we credibly win? Note that this does not make keyword research obsolete, and the keyword research fundamentals still drive what you actually build. It changes the job keyword data is asked to do: it stops being the forecast and becomes the sanity check on the forecast.
Building a TAM-based SEO forecast, step by step
- Size the audience, not the keyword list. Start from market data: how many potential customers exist in your addressable segments (region, language, company size, use case)?
- Estimate the searching share. What fraction of that audience uses search at some point in their journey? Analogous funnels, industry research, and your own paid-search data inform this.
- Segment by intent tier. Split the searchable demand into problem-aware, solution-aware, and brand/comparison tiers, because capture rates and values differ by an order of magnitude between them.
- Apply honest capture-rate scenarios. Model conservative/base/optimistic shares of each tier based on your current authority, content coverage, and competitive position, not on hoped-for rankings.
- Convert to business value. Multiply captured visits by measured conversion rates and value per conversion, so the forecast speaks revenue, the language the budget decision is actually made in.
- State the assumptions on the page. The forecast's value is the argument, not the number. Every input above should be visible and challengeable by the stakeholder reading it.
This is also the honest way to answer the executive question underneath every forecast request, namely is SEO worth the budget?, and to make the comparison against paid acquisition explicit, which we walk through in SEO vs paid search: where each dollar works.
A worked example of the arithmetic
The steps above are easier to argue with once they have numbers attached. The table below walks a single hypothetical B2B segment through the funnel. Treat every figure as illustrative arithmetic, not as a benchmark: these are placeholder inputs chosen to show the shape of the calculation, and your own numbers must come from your market data, your analytics, and your paid-search account.
| Step | Input used | Where the input comes from | Running figure |
|---|---|---|---|
| 1. Addressable audience | 40,000 companies in the target region, size band, and vertical | Market sizing, industry association data, your CRM's total serviceable list | 40,000 accounts |
| 2. Share that searches | 60% touch search at some point in the buying journey | Paid search impression share, buyer surveys, analogous funnels you have run | 24,000 accounts |
| 3. Intent tier split | 60% problem aware, 30% solution aware, 10% brand or comparison | Your own query mix in Search Console, plus paid keyword data | 14,400 / 7,200 / 2,400 |
| 4. Capture rate, base case | 4% problem aware, 12% solution aware, 35% brand or comparison | Current authority, content coverage, and honest competitive read | 576 + 864 + 840 = 2,280 accounts reached |
| 5. Convert to value | 3% of reached accounts convert, at 6,000 in value each | Measured conversion rate and value per deal, never assumed | Roughly 68 conversions, about 410,000 in value |
Two things become obvious once the arithmetic is on the page, and both are the point of doing it this way. First, the brand and comparison tier is a tenth of the volume but contributes more reached accounts than the problem-aware tier, which is what an executive needs to see before approving a plan built entirely on top-of-funnel blog posts. Second, the number that a stakeholder will most want to argue about is the capture rate in step four, which is exactly the assumption that deserves the argument. A volume-based forecast hides that debate inside an assumed ranking position where nobody can find it.
Run the same table three times, with conservative, base, and optimistic capture rates, and hand over the range. The spread between the low and high case is itself information: a narrow spread means the outcome is mostly determined by market size, and a wide one means it is mostly determined by execution. For the vocabulary behind these terms, see our SEO forecasting glossary, and for turning the output into a business case, SEO ROI.
Forecasting approaches compared
| Approach | How it works | Strengths | Weaknesses |
|---|---|---|---|
| Keyword-volume model | Sum tool volumes, times assumed position, times a CTR curve | Fast; granular; easy to present | False precision; misses long tail; position assumptions unfounded; ignores SERP-feature click absorption |
| Trend/regression model | Project forward from your own historical traffic | Grounded in real site data | Assumes the past continues; blind to market ceilings, algorithm shifts, and new competition |
| TAM-based model | Size total searchable demand, apply capture-rate scenarios | Business-credible ceiling; scenario-based honesty; ties to revenue | Inputs are estimates; requires market data; less granular for content planning |
| Blended (TAM ceiling + bottom-up checks) | TAM sets the ceiling; keyword and trend data sanity-check the path | Best of both; catches inconsistencies in either direction | Most effort; needs discipline not to cherry-pick the higher number |
In practice the blended row is the answer for most teams: use TAM to set the ceiling and the narrative, then use bottom-up keyword and trend data to check that the capture-rate scenario is achievable with the content you can actually ship.
What's changed since this was written
The core argument has aged well; the inputs have moved against volume-based models even further. AI Overviews and answer engines now resolve a meaningful share of informational queries with no click at all, which breaks historical CTR curves and makes "search volume" an even weaker proxy for capturable visits. At the same time, some demand is migrating to conversational assistants where keyword tools have no visibility, and that is demand a TAM lens still counts, because it starts from people with the problem rather than from logged queries. The practical update: model click-capture rates per intent tier more conservatively than pre-AI benchmarks, treat brand/comparison and transactional tiers as the defensible core, and measure success against business outcomes rather than raw sessions, which is the approach in how to tell if your SEO is actually working.
Frequently asked questions
Total Addressable Market applied to search: the full population of searchers who could plausibly become your customers, used as the ceiling for what SEO can ever deliver, before estimating what share you can capture.
Keyword forecasts build bottom-up from tool volumes and assumed rankings. TAM forecasts build top-down from market size and searching behavior, then apply capture-rate scenarios. The first optimizes for precision it cannot have; the second optimizes for honest ranges.
Point predictions are almost always wrong; scenario ranges with stated assumptions are useful. Treat any single-number, month-by-month SEO forecast as a sales artifact, not an analysis.
Market or audience sizing for your segments, evidence of what share of that audience searches (paid-search impressions are a good proxy), your measured conversion rates, and a competitive read on what capture rate is credible for your site today.
They reduce clicks on informational queries without reducing underlying demand, so forecasts must separate demand from clicks: model lower capture rates on informational tiers and weight bottom-of-funnel demand more heavily.
Quarterly against actuals. The point of a scenario-based forecast is to learn which assumptions were wrong and tighten them, because a forecast that is never reconciled to reality is theater.
This resource contributes to the knowledge base SEO practitioners need for effective optimization in an evolving search landscape.
Source: https://productledseo.substack.com/p/forecasting-seo-with-total-addressable
Take this with you
The assistant links open with a question about this page already written. Nothing is sent until you press enter.
Claude Vincent is a technical SEO consultant focused on crawlability, rendering, and AI-search visibility. He writes the field guides and case studies at SEO ProCheck, with a bias toward the durable, unglamorous work that decides whether search engines and AI answer engines can actually read and cite a site.
About SEO ProCheck
Technical SEO consulting and GEO strategy with 20 years of enterprise experience. Case studies, resources, and tools for search and AI visibility.
Work With Me
Technical SEO audits, GEO strategy, site migrations, and international SEO. Hourly consulting for teams who need hands-on support, not just reports.
Subscribe to our newsletter!








Recent Posts
- Most Top Sites Never Say Who They Are in Structured Data October 14, 2026
- Homepage Titles Are Mostly Too Short, Not Too Long October 8, 2026
- Who Actually Serves an llms.txt? 184 Top Sites Measured September 29, 2026