

AI Summary
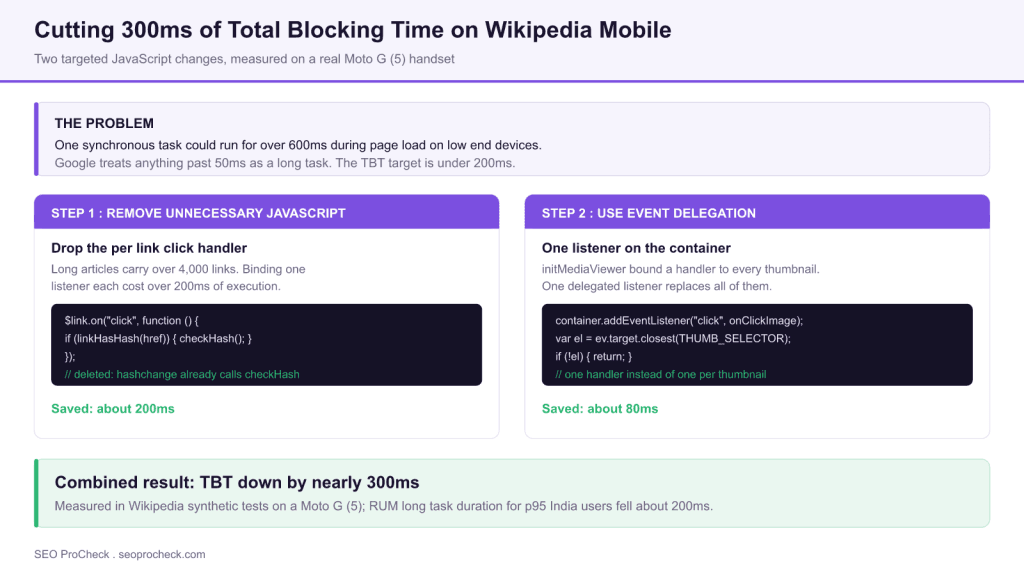
Wikipedia's mobile site carried a single JavaScript task that could run for more than 600ms during page load on low end phones, blocking every user interaction while it ran. Two narrow changes, deleting a redundant per link click handler and switching thumbnail clicks to event delegation, cut Total Blocking Time by nearly 300ms on a Moto G (5).
- A long task is anything over 50ms; TBT counts only the portion past 50ms, summed between FCP and TTI.
- Step 1 removed a
.on("click")binding applied to every link, over 4,000 of them on articles like United States, worth about 200ms. - Step 2 replaced one listener per thumbnail with a single delegated listener using
ev.target.closest(), worth about 80ms. - Real user monitoring for p95 India users showed roughly 200ms less long task duration before the load event.
- TBT is the lab proxy for Interaction to Next Paint, the Core Web Vital that actually reaches ranking systems.

Nicholas Ray, a performance engineer working on Wikimedia's mobile site, published a walkthrough of two changes that removed nearly 300 milliseconds of Total Blocking Time from Wikipedia's mobile experience. It is worth reading closely because it is the opposite of the usual performance case study: no framework migration, no CDN change, no rearchitecture. Two blocks of JavaScript, one deleted and one rewritten, on a site serving billions of pageviews.
What Total Blocking Time actually measures
Only one task can occupy the browser's main thread at a time. If a user taps a button while a 600ms script is executing, the browser cannot run the click handler, and it cannot paint the visual response, until that script finishes. The user perceives anything slower than about 100ms to visual feedback as sluggish, which is why Google classifies any main thread task over 50ms as a long task.
Total Blocking Time sums the blocking portion of every long task between First Contentful Paint and Time to Interactive. The blocking portion is the time after the first 50ms. Working through the arithmetic makes the metric far less mysterious:
| Task duration | Long task? | Contribution to TBT | Why |
|---|---|---|---|
| 30ms | No | 0ms | Below the 50ms long task threshold |
| 80ms | Yes | 30ms | 80ms minus the 50ms allowance |
| 100ms | Yes | 50ms | 100ms minus the 50ms allowance |
| 600ms | Yes | 550ms | A single task blowing the entire 200ms budget |
| Total for rows 1 to 3 | 80ms | TBT is the sum of the blocking portions only |
TBT counts only the time each task spends past 50ms, which is why one very long task hurts far more than several short ones.
The practical consequence: a page with ten 45ms tasks has a TBT of zero, while a page with one 600ms task has a TBT of 550ms. Splitting work into smaller chunks is a legitimate fix even when the total work is identical. Wikipedia's single offending task was roughly three times the entire recommended 200ms budget on its own.
Step 1: delete the JavaScript that was not needed
Profiling the mobile site pointed at an _enable method that set up section expand and collapse behaviour. Inside it, a jQuery .on("click") call attached a listener to nearly every link in the article body, so that clicking an internal link with a hash fragment would reveal the target section.
var $link = $container.find("a:not(.reference a)");
$link.on("click", function () {
  if (linkHasHashFragment($link.attr("href"))) {
    checkHash();
  }
});
util.getWindow().on("hashchange", function () { checkHash(); });
On a short article this costs nothing. On the English Wikipedia article for United States, which carries over 4,000 links, binding cost over 200ms of execution on low end devices. The decisive finding was not that the code was slow, it was that the code was redundant: the hashchange handler directly below already called checkHash. Unless the window location already pointed at the link destination, clicking a link ran checkHash twice.
The fix was deletion. This is the part practitioners routinely skip. Before optimising a hot function, check whether its effect is already produced elsewhere in the codebase. The fastest JavaScript is the JavaScript you do not ship.
Step 2: replace per element listeners with event delegation
A second review found initMediaViewer taking roughly 100ms. It attached a click listener to every thumbnail so that a tap would open the media viewer. Same anti pattern, different elements, and the same scaling problem: Wikipedia editors can and do build articles containing thousands of images.
// before: one listener bound per thumbnail
function initMediaViewer($container) {
  currentPageHTMLParser.getThumbnails($container).forEach(function (thumb) {
    thumb.$el.off().data("thumb", thumb).on("click", onClickImage);
  });
}
The rewrite attaches a single listener to the container that holds all the images, then uses Element.closest() inside the handler to work out whether the click originated from a thumbnail or one of its children. Events bubble, so one listener at the top can serve any number of descendants, including elements injected after page load.
// after: one delegated listener on the container
function onClickImage(ev) {
  var el = ev.target.closest(PageHTMLParser.THUMB_SELECTOR);
  if (!el) { return; }
  var thumb = currentPageHTMLParser.getThumbnail($(el));
  if (!thumb) { return; }
  ev.preventDefault();
  routeThumbnail(thumb);
}

function initMediaViewer(container) {
  container.addEventListener("click", onClickImage);
}
Note the early returns. A delegated handler fires for every click anywhere inside the container, so the first job of the handler is to bail out cheaply when the click is not interesting. Get that wrong and you trade a slow page load for a slow interaction, which under Interaction to Next Paint is the worse trade.
What the two deploys actually produced
The changes shipped as two separate deploys, step 1 first, which is why the individual attributions below are credible rather than guesswork. Anyone shipping performance work should copy that discipline: bundle five fixes into one release and you will never know which one paid.
| Change | Technique | Measured saving | Where it was measured |
|---|---|---|---|
| Remove the per link click handler | Delete redundant JavaScript | About 200ms | Wikipedia synthetic test, Moto G (5) |
| Rewrite initMediaViewer | Event delegation on one container | About 80ms | Wikipedia synthetic test, Moto G (5) |
| Both deploys combined | Nearly 300ms of TBT | Long articles on the mobile site | |
| Field data | Real user monitoring | About 200ms less long task duration | p95 India users, before the load event |
Figures as reported by Nicholas Ray in the source article. The two changes shipped as separate deploys, which is what made the individual attributions possible.
The author is explicit that the job is not finished: the task still exceeds the recommended limit on low end devices, and further gains would require breaking the remaining work into smaller tasks rather than removing more of it.
How to run this diagnostic on your own site
The methodology transfers directly to any content site with user generated or editor generated markup.
1. Chrome DevTools > Performance panel
   CPU throttle: 4x or 6x slowdown, Network: Slow 4G
   Record, reload, stop. Long tasks show a red corner flag.

2. Switch to the Bottom Up tab, sort by Self Time
   That names the function actually burning the main thread.

3. Confirm in the lab with Lighthouse
   npx lighthouse https://example.com/long-page/ \
     --only-audits=total-blocking-time,long-tasks \
     --form-factor=mobile --output=json

4. Ask three questions of the hot function, in this order:
   a. Can it be deleted? (is the behaviour duplicated elsewhere)
   b. Can it be delegated? (one listener instead of N)
   c. Can it be deferred or chunked? (yield to the main thread)
Test on your longest, heaviest page, not your homepage. These bugs are invisible on a thin template and severe on the page with 4,000 links. Pick the 95th percentile of DOM size in your own crawl and profile that URL.
Why this matters for SEO, not just for engineering
TBT is a lab metric and is not itself used in ranking. It matters because it is the best lab proxy for Interaction to Next Paint, which replaced First Input Delay as a Core Web Vital in March 2024 and is measured on real Chrome users. Long tasks during load are exactly what causes poor INP, because they sit between the user's tap and the browser's next paint.
The wider lesson for anyone briefing a development team: the highest value performance work is often subtraction. You can pair this with the measurement discipline in our Core Web Vitals checker and page speed analyzer to find which templates are worth profiling. For the commercial argument behind the engineering, our Vodafone page speed case study shows how a faster page translated into measurable sales, and our technical SEO audit service covers this class of main thread diagnosis as standard.
FAQ
Total Blocking Time is the sum of the blocking portion of every long task on the main thread between First Contentful Paint and Time to Interactive. A long task is anything over 50ms, and only the time past that 50ms counts. So an 80ms task contributes 30ms, a 100ms task contributes 50ms, and a 30ms task contributes nothing at all.
Google recommends keeping TBT under 200ms when tested on average mobile hardware. Lighthouse weights TBT heavily in the performance score. Wikipedia had a single task that could exceed 600ms on low end phones, roughly three times the entire recommended budget for one task alone.
TBT itself is not a Core Web Vital and is not used directly in ranking. It is a lab proxy for Interaction to Next Paint, which is a Core Web Vital and is measured on real users. Fixing the long tasks that inflate TBT is the most reliable lab side way to improve field INP.
Event delegation attaches one listener to a common ancestor element instead of one listener per child. Because events bubble, the single handler can inspect event.target and react. The cost of binding stops scaling with the number of elements on the page, which matters when user generated content can contain thousands of links or images.
Open Chrome DevTools, go to the Performance panel, enable a 4x or 6x CPU throttle, and record a page load. Long tasks appear as red flagged blocks in the main thread track. Expand the bottom up view to see which function owns the self time, then decide whether that code can be removed, deferred, or delegated.
No. The deleted block called checkHash when a user clicked a link containing a hash fragment, but the existing hashchange listener already called the same method. Clicking a link ran checkHash twice. Removing the click handler left functionality effectively unchanged while freeing nearly 200ms of main thread time.
Is a long task quietly capping your INP?
We profile your heaviest templates on throttled mobile hardware and hand your developers a ranked, named list of functions to delete, delegate, or defer.
Source: https://www.nray.dev/blog/300ms-faster-reducing-wikipedias-total-blocking-time/
Claude Vincent is a technical SEO consultant focused on crawlability, rendering, and AI-search visibility. He writes the field guides and case studies at SEO ProCheck, with a bias toward the durable, unglamorous work that decides whether search engines and AI answer engines can actually read and cite a site.
About SEO ProCheck
Technical SEO consulting and GEO strategy with 20 years of enterprise experience. Case studies, resources, and tools for search and AI visibility.
Work With Me
Technical SEO audits, GEO strategy, site migrations, and international SEO. Hourly consulting for teams who need hands-on support, not just reports.
Subscribe to our newsletter!







Recent Posts
- Can AI Crawlers Actually Read Your Site? I Measured 400 of the Biggest September 5, 2026
- The Pre-Publish Quality Gate for AI-Assisted Content August 6, 2026
- AGENTS.md vs llms.txt vs llms-full.txt: Which Agent File Does What July 18, 2026