

How QuintoAndar increased conversion rates and pages per session by improving page performance
- October 12, 2021
- Web Performance
AI Summary
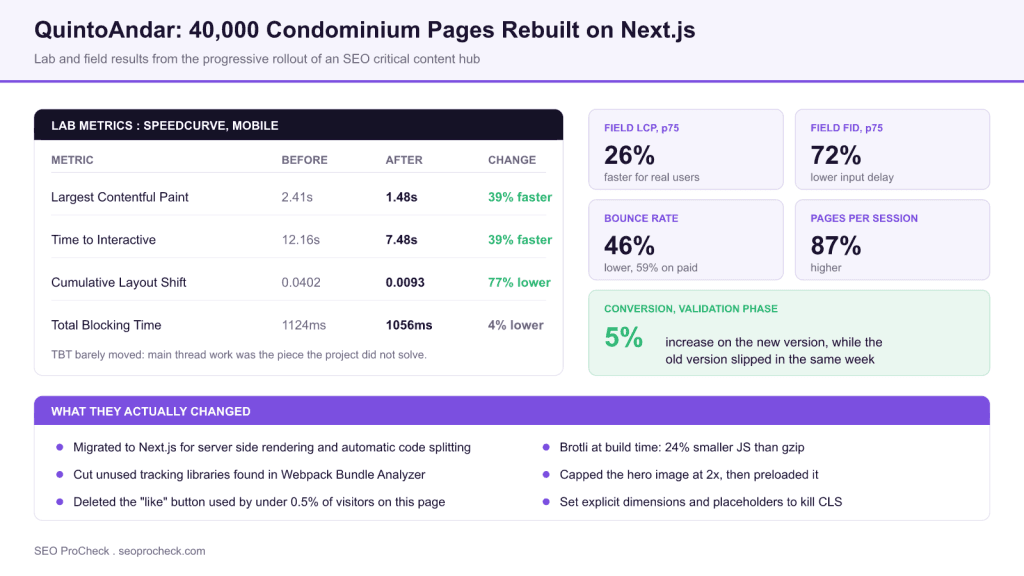
QuintoAndar rebuilt a 40,000 page condominium content hub on Next.js and shipped it through a three phase progressive rollout. Lab LCP fell from 2.41s to 1.48s and CLS from 0.0402 to 0.0093, while Google Analytics showed a 46 percent lower bounce rate, 87 percent more pages per session and a 5 percent conversion increase during validation.
- Field data at the 75th percentile for mobile: LCP down 26 percent, FID down 72 percent, measured in Instana.
- The biggest wins came from deletion: unused tracking libraries, and a like button used by under 0.5 percent of visitors on that page.
- Static Brotli compression at build time beat CDN gzip by 24 percent on JavaScript size, up from 18 percent with on the fly compression.
- The hero image was capped at 2x resolution, about 35 percent smaller than 3x, then preloaded.
- Total Blocking Time barely moved, down only 4 percent, which is the honest limit of what this project achieved.
Written up on web.dev by Daniela Sayuri Yassuda, this is one of the more useful Core Web Vitals case studies available, for two reasons. It reports a metric that did not improve, and it uses a rollout design that actually supports the causal claim being made. Both are rarer than they should be.
The starting position
QuintoAndar is a Brazilian proptech company offering end to end digital services for real estate. The asset in question is a condominium content hub of over 40,000 pages where users find property information, photos of common areas, neighbourhood detail and available listings.
These pages mattered commercially for a specific reason worth noting: they were a growing source of organic traffic, and they converted well over the medium to long term compared with other parts of the app. That is the classic profile of an informational hub feeding a considered purchase, and it is exactly the kind of asset that gets underinvested in because the conversion is not immediate.
The problems were the ones you would expect: Core Web Vitals were not optimised, with known slow loads, slow responsiveness and layout instability, and bounce rates were high. Behind that sat a developer experience problem. Their server side rendering logic was built in house and had grown too complex to maintain or to onboard new hires against, and features like code splitting required manual setup per page or component, so adoption stalled.
What they changed, in order of impact
1. Delete JavaScript nobody uses
The first step was removing unused code. Webpack Bundle Analyzer reports showed the contents of each bundle, and a review of third party scripts turned up tracking libraries that were not used on this particular page.
Then they went further, and this is the part worth stealing. The like button on the condominium page required a significant amount of JavaScript. Fewer than 0.5 percent of users on that page interacted with it. After a joint engineering and product discussion, they removed the feature from that template.
Most performance backlogs never contain a line item that reads delete a feature, because features are owned by product and performance is owned by engineering. Pulling interaction rate data per template into the conversation is what makes that negotiation possible.
2. Compress at build time, not at the edge
// CDN gzip                    baseline
// CDN Brotli (on the fly)     18% smaller than gzip
// Static Brotli at build time 24% smaller than gzip

// webpack.config.js
const BrotliPlugin = require("brotli-webpack-plugin");

module.exports = {
  plugins: [
    new BrotliPlugin({
      asset: "[path].br[query]",
      test: /\.(js|css|html|svg)$/,
      threshold: 10240,
      minRatio: 0.8
    })
  ]
};
The reason build time compression wins is that it happens once, offline, so it can afford the maximum Brotli quality setting. On the fly compression at the edge has to return bytes within a request, so it uses a much lower setting. Six percentage points of JavaScript weight for a build config change is one of the better trades in front end performance.
3. Cap image resolution, then preload the LCP element
The hero image occupies most of the area above the fold on mobile and was the LCP element. Images already had srcset and sizes, with Thumbor resizing on demand behind a CDN cache. The gain came from recognising that high density displays will happily request a 3x or 4x asset that no human eye can distinguish from 2x. Capping at 2x made the file roughly 35 percent smaller than the 3x version and 50 percent smaller than the 4x.
      href="/img/450x450/892847321-143.0038687080606IMG20180420WA0037.jpg"
      as="image">
Preloading only pays once the element is genuinely the LCP element and its URL is knowable in the HTML. Preload an image that is not the LCP element and you have simply added contention for bandwidth.
4. Reserve space for anything that arrives late
The layout shifts came from elements rendered only on the client: components hydrating over server rendered markup, and images without width and height attributes. The fixes were exact dimensions where known, min-height estimates where not, the aspect-ratio CSS property as an option, and placeholders for dynamically rendered components. CLS went from 0.0402 to 0.0093.
5. Move to Next.js, for maintainability as much as speed
The framework migration solved the developer experience problem: server side rendering out of the box, which preserved the hard crawlability requirement, plus automatic code splitting and prefetching that no longer needed per developer effort. With over 30 React web applications in the company, the condominium hub was chosen as the pilot precisely because it was independent enough to fail safely.
The results, including the one that did not move
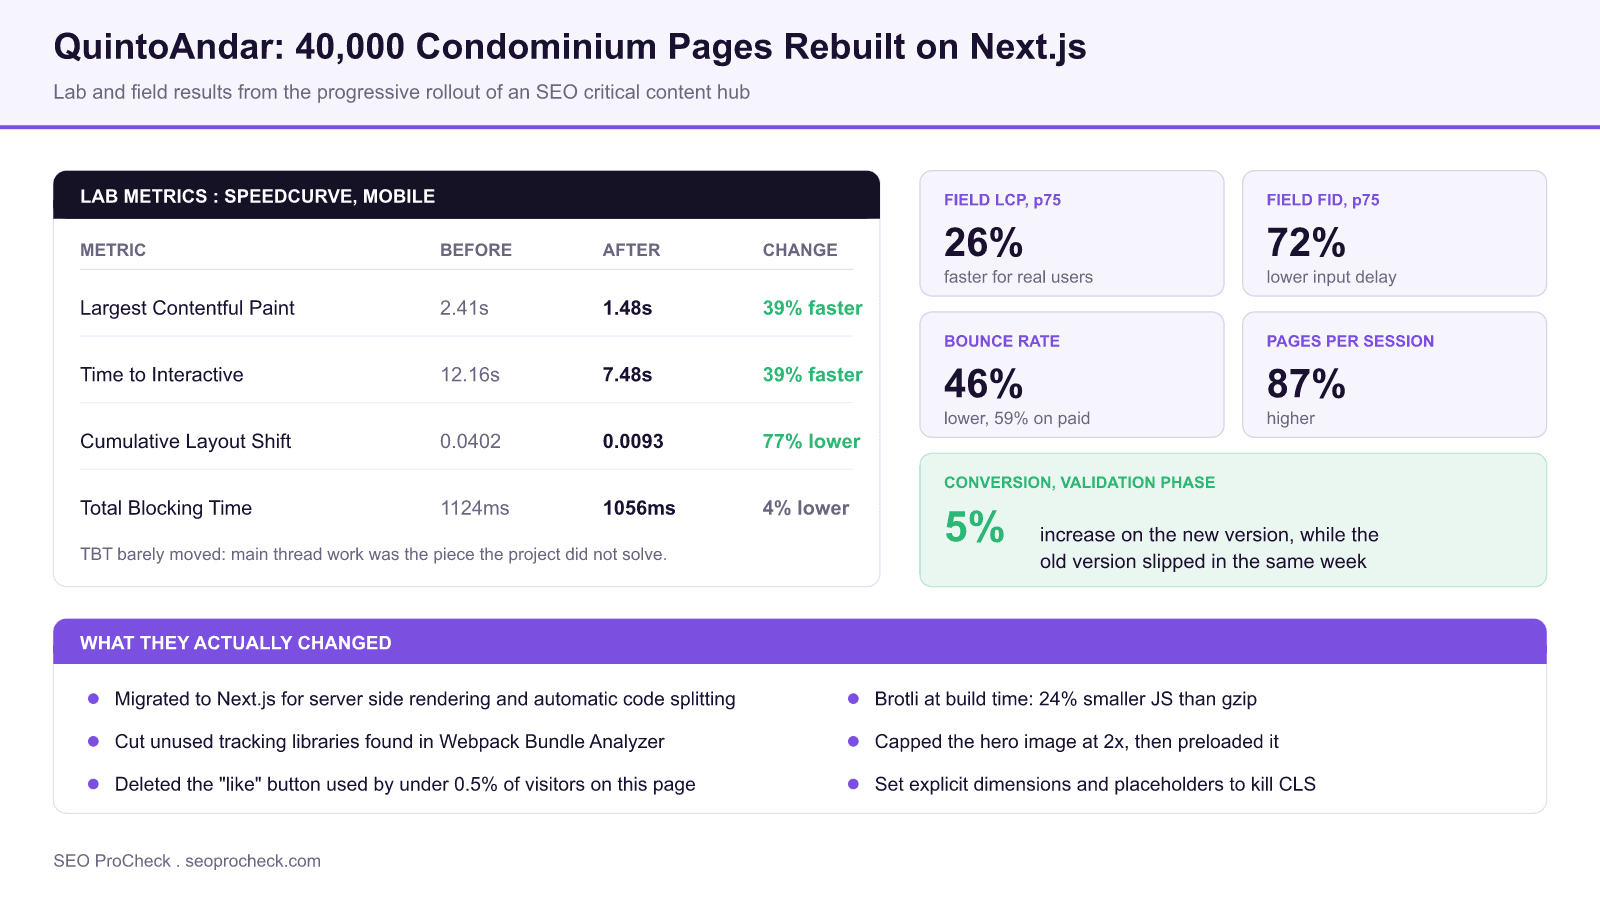
| Lab metric (SpeedCurve, mobile) | Before | After | Difference |
|---|---|---|---|
| Largest Contentful Paint | 2.41 seconds | 1.48 seconds | 39% faster |
| Time to Interactive | 12.16 seconds | 7.48 seconds | 39% faster |
| Total Blocking Time | 1124 milliseconds | 1056 milliseconds | 4% lower |
| Cumulative Layout Shift | 0.0402 | 0.0093 | 77% lower |
Lab data collected with SpeedCurve on the mobile version of the condominium page, as published in the source case study.
Total Blocking Time improved by 4 percent. That is close to noise, and the case study reports it anyway. The reading is straightforward: this project attacked what the browser had to download and when it painted, and did comparatively little about how long the main thread was busy executing what remained. Server side rendering and smaller bundles do not, on their own, shorten long tasks. If you want TBT, and by extension Interaction to Next Paint, you have to profile and break up the tasks themselves.
| Measure | Result | Source of the number |
|---|---|---|
| Field LCP, 75th percentile mobile | 26% lower | Instana Website Monitoring, one month before against one month after |
| Field FID, 75th percentile mobile | 72% lower | Instana Website Monitoring |
| Bounce rate | 46% lower | Google Analytics, after full rollout |
| Bounce rate, paid search traffic | 59% lower | Google Analytics |
| Pages per session | 87% higher | Google Analytics |
| Average session duration | 49% higher | Google Analytics |
| Conversion rate | 5% higher on the new version | Same week comparison against pages still on the old version, during validation |
Conversions here mean transactions such as scheduling a tour and applying to rent or buy. The case study is explicit that long term growth on this hub has several causes, including operational expansion and indexing improvements, and positions performance as one contributing factor rather than the sole cause.
Why the rollout design is the most transferable part
The three phase rollout, a few hundred users a day, then a few thousand, then everything, did three jobs at once. It contained the risk of rebuilding 40,000 indexed URLs. It let the team keep measuring in production and keep fixing. And critically, it created a live control group.
That control group is why the conversion claim holds up. In the same week, pages on the new version showed a 5 percent conversion increase while pages still on the old version showed a slight decrease. A simple before and after comparison would have been indistinguishable from seasonality, a campaign, or a Google update. A parallel comparison is not a randomised experiment, but it removes most of the obvious confounders.
The case study is also careful about its own claims in the conclusion, noting that long term growth on the hub has several contributing factors including operational expansion and SEO work on page indexing, and positioning performance as one factor with strong potential rather than the whole story. That restraint is worth copying when you write up your own results.
Applying this to your own content hub
Checklist, in the order QuintoAndar found value:

1. npx webpack-bundle-analyzer stats.json
   Which third party scripts does THIS template not need?

2. Pull interaction rate per feature, per template, from analytics.
   Anything under about 1% is a candidate for removal on that template.

3. Check your compression:
   curl -sI -H "Accept-Encoding: br" https://example.com/app.js \
     | grep -i content-encoding
   If it says gzip, or br served on the fly, move it to build time.

4. Identify the LCP element, cap its density at 2x, preload it.

5. Audit every client rendered component for reserved space.

6. Roll out in phases, and keep the old version live as a control.
If you are working out which of your templates deserve this treatment, our Core Web Vitals checker and page speed analyzer will tell you where the field data is failing. For large hubs where crawling and indexing are as much of a constraint as speed, our performance and indexation service covers both together, and the Vodafone page speed case study is the one page version to hand to a stakeholder.
FAQ
QuintoAndar measured a 5 percent conversion increase on the optimised pages during the validation phase, while the group still running the old version showed a slight decrease in the same week. That parallel comparison is what makes the result credible: seasonality and campaign effects hit both groups equally, so the divergence is attributable to the change.
It was here, but the framework was not the point. QuintoAndar's hard requirement was that pages remain crawlable, and Next.js gave them server side rendering without the in house setup they had been maintaining. The measurable wins came from removing JavaScript, capping image resolution and fixing layout shift, all of which are framework independent.
More than most teams assume. QuintoAndar reviewed Webpack Bundle Analyzer output, removed tracking libraries that were not used on that template, and deleted a like button feature entirely because fewer than 0.5 percent of users on the condominium page ever clicked it. Feature usage data is a legitimate performance tool.
Yes, and where you apply it matters. Relying on the CDN to compress on the fly gave QuintoAndar an 18 percent reduction in JavaScript size versus gzip. Switching to static Brotli compression at build time, using BrotliWebpackPlugin, took that to 24 percent, because build time compression can afford a much higher effort setting than on the fly compression can.
Usually not. QuintoAndar capped their hero image at the 2x version, which is roughly 35 percent smaller than the 3x version and 50 percent smaller than the 4x. Past 2x, the file size continues to grow while the human eye struggles to perceive the difference, so you are paying LCP for pixels nobody sees.
QuintoAndar released the new version in three phases: a handful of hand picked URLs reaching a few hundred users a day, then a few thousand, then everything. It gives you a live control group for business metrics and it contains the blast radius if a rebuild of 40,000 indexed pages goes wrong.
Sitting on a large content hub that underperforms?
We audit crawlability, indexation and Core Web Vitals together, then give you a phased rollout plan with a control group built in.
Source: https://web.dev/quintoandar/
Take this with you
The assistant links open with a question about this page already written. Nothing is sent until you press enter.
Claude Vincent is a technical SEO consultant focused on crawlability, rendering, and AI-search visibility. He writes the field guides and case studies at SEO ProCheck, with a bias toward the durable, unglamorous work that decides whether search engines and AI answer engines can actually read and cite a site.
About SEO ProCheck
Technical SEO consulting and GEO strategy with 20 years of enterprise experience. Case studies, resources, and tools for search and AI visibility.
Work With Me
Technical SEO audits, GEO strategy, site migrations, and international SEO. Hourly consulting for teams who need hands-on support, not just reports.
Subscribe to our newsletter!








Recent Posts
- Most Top Sites Never Say Who They Are in Structured Data October 14, 2026
- Homepage Titles Are Mostly Too Short, Not Too Long October 8, 2026
- Who Actually Serves an llms.txt? 184 Top Sites Measured September 29, 2026