

Luxury retailer Farfetch sees higher conversion rates for better Core Web Vitals
- July 12, 2022
- Web Performance
AI Summary
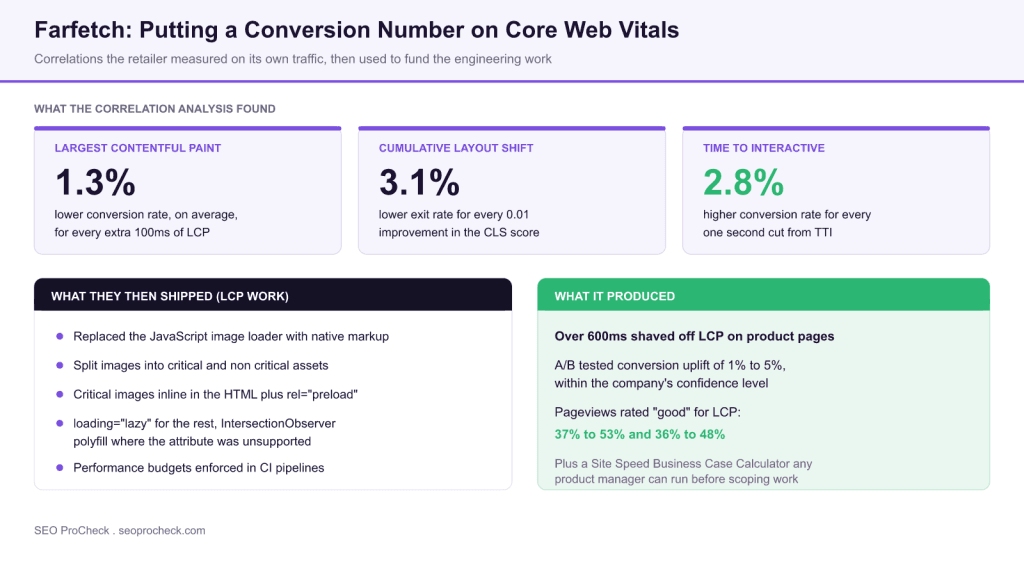
Farfetch joined its Core Web Vitals field data to its own conversion tracking and measured the relationship directly: conversion rate fell on average 1.3 percent for every extra 100ms of LCP, and exit rate fell 3.1 percent for every 0.01 improvement in CLS. They then used those numbers to fund image loading work that removed over 600ms from product page LCP.
- Conversion rate rose 2.8 percent for each second cut from Time to Interactive.
- The join was made by pushing web-vitals.js measurements into the same data layer as their Omnitracking conversion events, per session.
- The LCP fix: native image loading instead of a JavaScript loader, critical images inline plus
rel="preload",loading="lazy"only for non critical images. - A/B testing showed a conversion uplift in the range of 1% to 5% at the company's defined confidence level.
- The lasting output was cultural: a self service Site Speed Business Case Calculator that lets any product manager price a performance improvement.
Most Core Web Vitals case studies tell you what a team fixed. This one, written up on web.dev by Manuel Garcia, Dikla Cohen, Patricia Couto Neto and Rui Santos, is more useful than that, because the interesting work happened before any code changed. Farfetch's problem was not that their pages were slow. It was that nobody outside engineering had any reason to care, so performance lost every prioritisation argument it entered.
The fix was to stop describing performance in milliseconds and start describing it in revenue. Everything else followed from that.
Step 1: make the data joinable
Farfetch already had a multi channel tracking system called Omnitracking, which recorded pageviews, user actions and system actions and fed a data model used for funnel and conversion analysis. The decisive move was to add performance data for each pageview into that same data layer.
Field measurements were captured in the browser using the web-vitals.js library, supplemented with custom JavaScript for Time to First Byte, First Contentful Paint, First Paint and Time to Interactive, collected through the Performance API, the Long Tasks API and Google's polyfills.
// the shape of the join that makes everything else possible
import {onLCP, onCLS, onINP} from "web-vitals";

function report({name, value, id}) {
  dataLayer.push({
    event: "web_vitals",
    metric_name: name,          // LCP | CLS | INP
    metric_value: Math.round(value),
    metric_id: id,
    session_id: analytics.getSessionId(),  // the critical field
    page_type: window.PAGE_TYPE            // pdp | plp | home
  });
}

onLCP(report); onCLS(report); onINP(report);
That session_id is the whole trick. Without it, your performance data sits in one tool and your revenue data in another, and no amount of dashboarding will let you regress one against the other. With it, the analytics team can ask whether the sessions that converted were measurably faster than the sessions that did not.
Farfetch also set time based performance budgets for each metric across the main journey pages, added a governance process for budget breaches, and began enforcing budgets in CI pipelines so regressions surface during development rather than in the field weeks later.
Step 2: what the correlation analysis found
Google recommends LCP stay below 2.5 seconds. Farfetch studied that threshold against their own data and found that beyond it, conversion rate starts to drop and exit rate rises.
| Metric | Relationship Farfetch measured | What it implies operationally |
|---|---|---|
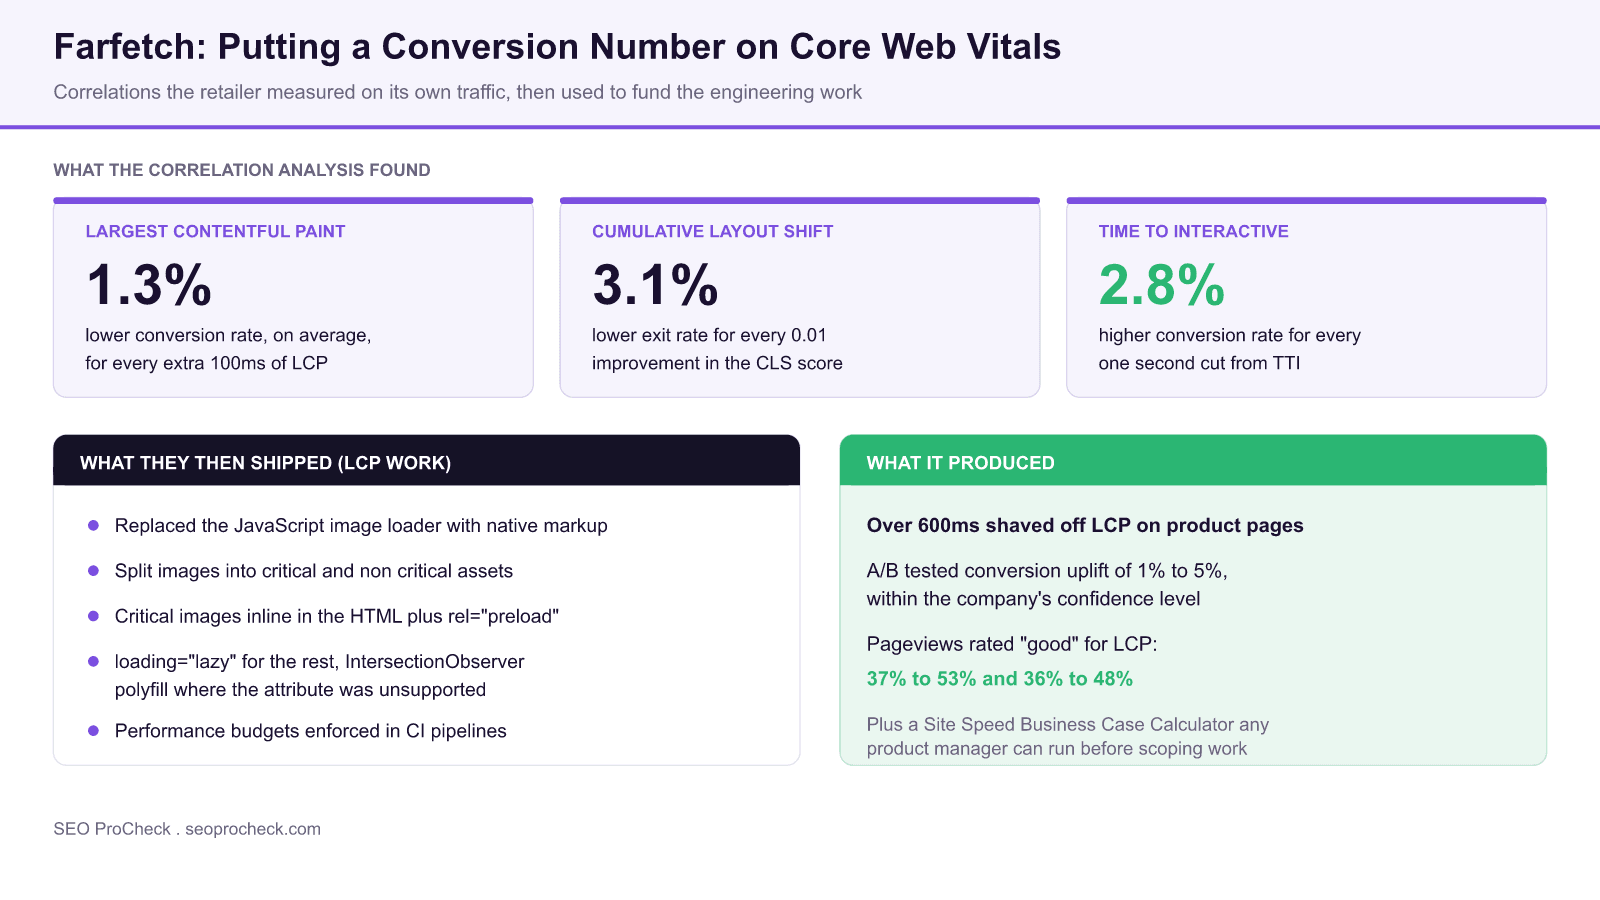
| Largest Contentful Paint | Conversion rate drops on average 1.3% for each extra 100ms of LCP, past the 2.5s threshold | Every 100ms of hero image work has a defensible price tag |
| Cumulative Layout Shift | Exit rate falls 3.1% for each 0.01 improvement in the CLS score | Reserving space for ads, banners and images is a retention lever, not a cosmetic one |
| Time to Interactive | Conversion rate rises 2.8% for each one second reduction in TTI | Main thread work and third party scripts have a measurable cost |
| Some other metrics | No significant impact on business KPIs, or relevance only at certain funnel stages | Not every metric deserves a budget; the analysis tells you which to drop |
Correlations derived from Farfetch's own field data joined to their Omnitracking conversion data. Treat the coefficients as directional evidence for building your own model, not as figures to quote for your site.
The fourth row deserves as much attention as the first three. The analysis also showed that some metrics had no significant impact on business KPIs, and that others mattered only at particular stages of the journey. Knowing which metrics do not pay is what stops a performance programme from becoming an infinite backlog.
One caveat the source itself raises: web.dev now cautions that measuring TTI in the field is no longer recommended, because user interaction introduces variance into the reading. Farfetch's TTI finding stands as reported, but anyone rebuilding this model today should substitute Interaction to Next Paint, which became a Core Web Vital in March 2024 and is designed for exactly this kind of field measurement.
Step 3: turn the coefficients into a self service tool
Rather than keep the model inside the analytics team, Farfetch built what they called the Site Speed Business Case Calculator, taking inspiration from Google's Speed Impact Calculator. Any product manager can use it to generate a business case for a performance improvement on the fly, adapted to different devices, product scopes and journey touchpoints.
They paired it with self service dashboards giving business wide visibility of real time performance indicators, and, because the performance data lives in the shared data layer, performance metrics also became available inside their A/B testing tooling. That last detail matters: it means any experiment can be checked for whether it accidentally regressed LCP.
Rui Santos, Farfetch's Web Channels Senior Principal Product Manager, is quoted in the case study on why this worked: "We wanted to break the cycle of performance being a tech-only concern, something owned only by the engineering team to deal with and fix. Connecting performance metrics with business metrics was surprisingly effective to pass the message across very, very quickly."
Step 4: the engineering work the business case paid for
The main opportunity identified in 2021 was LCP on the two page types that carry the revenue: product pages and product listing pages. The changes were unglamorous and entirely transferable:
1. Move the product image component off a JavaScript based loader
and onto native browser markup.
2. Classify every image as critical or non critical.
3. Critical images: source already inline in the HTML, plus a preload.
href="/product/hero-1000.avif"
imagesrcset="hero-400.avif 400w, hero-1000.avif 1000w"
imagesizes="(max-width: 999px) 100vw, 640px">
4. Non critical images: ![]()
with an IntersectionObserver polyfill for browsers such as
Safari that did not support the attribute at the time.Note what is absent: no framework migration, no CDN change, no rewrite. The single largest structural change was deleting a JavaScript image loader, which is the same lesson as the Shopify and Wikipedia case studies in this collection. JavaScript that stands between the browser and a resource it could have fetched from static markup is almost always a net loss.
| Page type | Pageviews rated good for LCP, before | After | Change |
|---|---|---|---|
| Product listing pages | 37% | 53% | 16 percentage points |
| Second main page type (product pages) | 36% | 48% | 12 percentage points |
| Product page LCP | Over 600ms faster | A/B tested conversion uplift of 1% to 5% |
Distribution figures read from the stacked bar charts in the source. Note that web.dev labels both charts as listing pages in their alt text, while the surrounding copy describes work on two page types, product pages and product listing pages. We have flagged that rather than resolve it.
How to replicate this without a data engineering team
You do not need Omnitracking. A minimum viable version of the Farfetch model takes a few days:
- Instrument. Add
web-vitals.jsand send LCP, CLS and INP to GA4 as custom events with the page type as a parameter. Google publish a reference implementation for this. - Segment. In GA4 Explorations, build a comparison of sessions with good LCP against sessions with poor LCP, and put conversion rate and engagement rate side by side.
- Control for the obvious confounders. Slow sessions skew towards older devices, cheaper networks and different countries, all of which independently affect conversion. Segment by device category and country before you claim a causal number, or your model will simply rediscover that rich users buy more.
- Prove it with a test. Correlation funds the hypothesis; an A/B test on one template confirms it. Farfetch did exactly this, and their reported uplift range of 1% to 5% is stated with the confidence level attached, which is the honest way to report a result.
That last point separates a credible internal case from a discredited one. Anyone can produce a chart showing fast sessions convert better. The Farfetch programme survived scrutiny because the correlation was followed by a controlled test.
Where to start on your own site
Find out which templates fail in the field first, using our Core Web Vitals checker, then isolate whether the problem is load delay or render delay with the page speed analyzer. For the boardroom version of this argument, our Vodafone page speed case study is the shortest available proof that speed moves sales, and technical SEO versus content SEO covers how to weigh this work against everything else competing for the same sprint.
FAQ
On Farfetch's own traffic, yes, and they measured the size of the effect. Conversion rate fell on average 1.3 percent for each additional 100ms of LCP, and rose 2.8 percent for each second removed from Time to Interactive. These are correlations from one retailer's data, not universal constants, but the method of deriving them is reproducible on any site with session level analytics.
Farfetch captured field metrics in the browser using the web-vitals.js library and pushed each pageview's values into the same data layer that already carried their conversion tracking. Because the performance value and the commercial outcome share a session identifier, the analytics team could model one against the other directly. Without that join, performance data and revenue data live in separate tools and never meet.
It is an internal self service tool Farfetch built, inspired by Google's Speed Impact Calculator, that lets any product manager estimate the revenue impact of a proposed performance improvement before the work is scoped. It uses the correlation model between conversion rate and user experience metrics and adapts to different devices, product scopes and journey touchpoints.
No. Farfetch explicitly divided images into critical and non critical assets. Critical images were inlined in the HTML source and preloaded so they download as early as possible; the lazy loading attribute was reserved for non critical images further down the page. Lazy loading an LCP element is one of the most common self inflicted LCP regressions in ecommerce.
The source article carries a caution from web.dev that measuring TTI in the field is no longer recommended, because user interaction introduces variance. Farfetch's TTI correlation is still instructive, but a team starting this work today should use Interaction to Next Paint, which replaced First Input Delay as a Core Web Vital in March 2024 and is designed for field measurement.
Take the Farfetch coefficient of 1.3 percent conversion per 100ms and apply it to your own numbers. On a site doing 500,000 sessions a month at a 2 percent conversion rate and an average order value of 120, a 300ms LCP improvement implies roughly 234 extra orders a month. Run the arithmetic with your own figures before you borrow anyone else's percentage.
Need the business case before the engineering?
We build the performance to revenue model on your own analytics data, then hand you the ranked template list that justifies the sprint.
Source: https://web.dev/farfetch/
Claude Vincent is a technical SEO consultant focused on crawlability, rendering, and AI-search visibility. He writes the field guides and case studies at SEO ProCheck, with a bias toward the durable, unglamorous work that decides whether search engines and AI answer engines can actually read and cite a site.
About SEO ProCheck
Technical SEO consulting and GEO strategy with 20 years of enterprise experience. Case studies, resources, and tools for search and AI visibility.
Work With Me
Technical SEO audits, GEO strategy, site migrations, and international SEO. Hourly consulting for teams who need hands-on support, not just reports.
Subscribe to our newsletter!







Recent Posts
- Can AI Crawlers Actually Read Your Site? I Measured 400 of the Biggest September 5, 2026
- The Pre-Publish Quality Gate for AI-Assisted Content August 6, 2026
- AGENTS.md vs llms.txt vs llms-full.txt: Which Agent File Does What July 18, 2026