

How Wix improved website performance by evolving their infrastructure
- March 31, 2019
- Web Performance
AI Summary
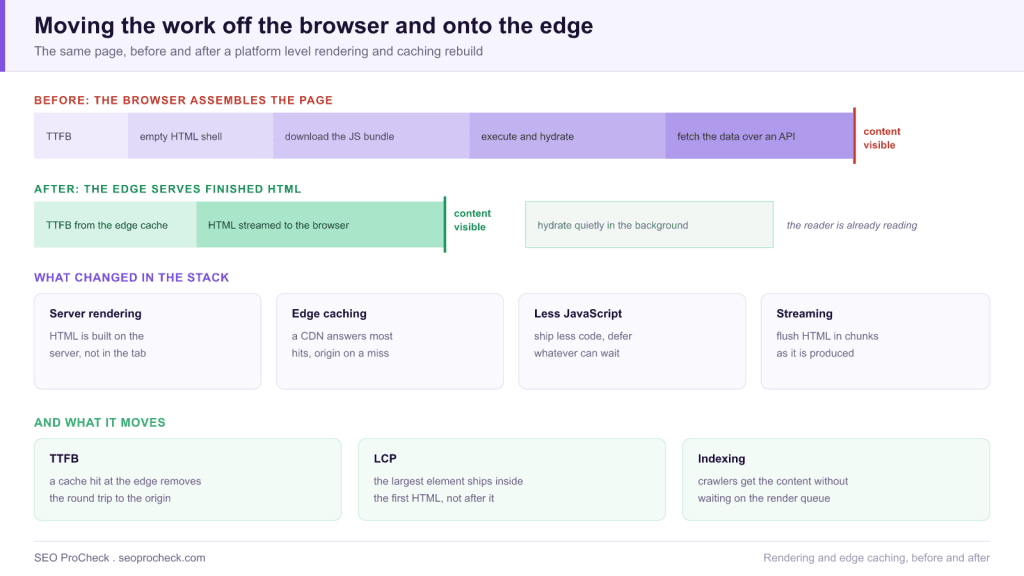
Wix improved performance by changing the infrastructure rather than by optimising individual sites, moving page assembly off the browser and onto the server and the CDN edge. The pattern generalises: server render the HTML, cache it at the edge, stream it as it is produced, and ship less JavaScript, so the content is visible before hydration rather than after it.
- LCP can never happen before TTFB. Every millisecond saved on the first byte is a millisecond available to the rest of the load.
- Caching HTML at the edge is the single biggest TTFB win, and cache key hygiene is what makes it safe.
- Streaming HTML lets the browser start parsing and fetching subresources before the server has finished the response.
- Server rendered HTML also removes the dependency on Google's render queue, so content is indexable from the first fetch.

Most performance advice is written for one site. A platform is a different problem: you cannot ask millions of site owners to change their pages, so the only lever that scales is the infrastructure underneath them. That is what makes this Wix case study worth reading even if you will never operate at that scale, because platform level thinking is exactly what you need when your own site has hundreds of templates and no appetite for hand tuning each one.
The notes below cover the architecture pattern this kind of rebuild follows, the caching decisions that make or break it, and the checks that tell you whether it worked, using measurements you can run yourself rather than borrowed benchmark numbers.
Why the first byte sets the ceiling
Time to First Byte is not a Core Web Vital, but it constrains one. Largest Contentful Paint cannot occur before the browser has received the response, so a slow TTFB puts a floor under LCP that no amount of image optimisation will lift. Google treats a TTFB of 0.8 seconds or less as good, and the practical way to hit that consistently is not a faster origin, it is not reaching the origin at all.
That is the structural insight behind an edge caching rebuild. An origin round trip costs the physical distance between the user and your servers plus the time to build the page. A cache hit at a nearby edge node costs the distance to the nearest city. For a global audience the difference is not a percentage, it is a category change, and it applies to every page equally rather than to whichever templates someone had time to optimise.
The four layers that change
| Layer | Change | Metric it moves | How to verify |
|---|---|---|---|
| Rendering | Build HTML on the server instead of in the browser | LCP, and indexability | Fetch the URL and confirm the main copy is in the raw response |
| Delivery | Cache the HTML at CDN edge nodes | TTFB, and origin load | Send a HEAD request and read the cache status response header |
| Transport | Stream the response in chunks as it is produced | First Contentful Paint, LCP | Watch the Network waterfall for early subresource requests |
| Client | Ship less JavaScript, defer and split the rest | INP, total blocking time | Compare transferred script bytes and main thread blocking in a trace |
The order matters. Caching a client rendered shell speeds up the delivery of an empty page, which improves TTFB while leaving the user staring at nothing, so rendering has to change before caching pays off. The background on server side rendering covers the tradeoffs on the rendering layer, and CDN and edge caching for SEO covers the delivery layer in more depth.
Cache key hygiene, where this goes wrong
Caching HTML is more dangerous than caching a stylesheet, because HTML is often personalised and always the thing search engines read. Every incident in this area traces back to one of the following.
| Hazard | What goes wrong | Control |
|---|---|---|
| Cookies in the cache key | Every analytics cookie value creates a unique entry, so the hit rate collapses | Strip all cookies from the key except the ones that genuinely change the HTML |
| Personalised HTML cached | One user's logged in page is served to everyone, or to Googlebot | Mark personalised routes as private and never cacheable at the edge |
| Tracking parameters | Campaign parameters fragment the cache into thousands of copies | Ignore known marketing parameters in the cache key |
| Varying on User Agent | Near infinite variants, and a real risk of serving crawlers a different page | Prefer responsive markup, and keep the Vary header minimal |
| No purge on publish | Updated pages stay stale, and crawlers keep indexing the old copy | Purge by URL or by tag from the publish pipeline, then verify the new copy |
| Caching error responses | A transient 500 or 404 is cached and served for hours | Never cache non 200 responses for more than a few seconds |
The Vary header deserves particular attention because it silently multiplies your cache entries and can change what a crawler receives; the details are in our guide to the Vary header and caching.
Technical Challenge
Technical SEO issues often create invisible barriers to ranking potential. This case study identifies the specific technical challenges addressed, from crawlability issues to performance bottlenecks. Understanding the problem scope helps practitioners diagnose similar issues.
At platform scale the barrier is that the slow part is not owned by anyone who can fix it. Individual site owners control their images and their app choices; the platform controls the rendering pipeline, the JavaScript runtime and the delivery network. Neither party alone can fix a poor field score, and the platform cannot ship a change that breaks even a small fraction of existing sites. That constraint, backward compatibility across an enormous installed base, is what makes infrastructure work slow rather than technically hard.
Diagnostic Process
Identifying technical issues requires systematic analysis using crawling tools, log file analysis, and Search Console data. This case study documents the diagnostic methodology that uncovered actionable issues. The process itself provides value for practitioners building technical audit capabilities.
Diagnosis at this level starts by separating what the server costs from what the browser costs. Split the load into three buckets: the time before the first byte, the time from first byte to the largest paint, and the main thread work after that. TTFB problems are network and origin problems, so look at cache hit ratio, origin response time and connection setup. The gap between first byte and LCP is a resource problem, so look at render blocking CSS, font loading and the LCP image's discovery time. Work after LCP is a JavaScript problem, so look at bundle size, long tasks and third party scripts. Log files add the crawler view: if Googlebot's fetch times differ from your users' times, you are probably serving crawlers from a colder cache.
Implementation and Solutions
Each identified issue required specific technical solutions implemented within development constraints. The case study details solutions for rendering issues, performance optimization, crawl management, and indexation improvements. Implementation approaches balance ideal solutions with practical constraints.
A safe rollout sequence for the same pattern on a normal site:
- Server render the templates that carry organic traffic. Prove the raw HTML contains the main content before touching anything else.
- Make the LCP element discoverable in that HTML. A hero image referenced only by JavaScript cannot be preloaded by the browser's preload scanner, which is one of the most common reasons a fast server does not produce a fast LCP.
- Introduce edge caching on the safest routes first. Static marketing and article pages, short time to live, explicit purge on publish, cookies stripped from the key.
- Enable streaming. Flush the head early so CSS, fonts and the LCP image start downloading while the body is still being generated.
- Cut JavaScript last. It is the slowest work politically, and by this point you have the measurements to justify which third party scripts are worth their cost.
Step two is worth dwelling on: our guide to improving LCP covers discovery time, which is usually a larger lever than image compression once the server side is fast.
Measurable Impact
Technical improvements demonstrate value through measurable outcomes: improved crawl stats, faster indexation, better Core Web Vitals scores, and ultimately improved rankings and traffic. This case study quantifies the impact of technical optimization.
Track four numbers, on two clocks. Immediately, from your own monitoring: edge cache hit ratio, origin request volume, and lab TTFB and LCP from a synthetic test on a fixed device profile. Over a 28 day window, from field data: the p75 of LCP, INP and CLS by device, plus the share of URL groups passing in Search Console. Crawl stats are the fourth signal and the most often ignored: a faster, more reliably cached site typically shows a lower average response time in the Search Console crawl stats report, and a site that responds faster tends to get crawled more. If your response times fall but crawl volume does not move at all, check whether crawlers are bypassing the cache.
Technical SEO case studies like this one help practitioners understand the tangible value of investing in site infrastructure.
This technical SEO case study demonstrates how resolving technical issues and optimizing site infrastructure directly impacts organic visibility. The documented approach provides a template for technical optimization initiatives.
FAQ
It usually improves LCP, because the largest element arrives inside the first HTML response instead of after a bundle downloads and executes. It does not automatically improve INP, since that depends on how much JavaScript still runs on the main thread after hydration.
Yes, and for a content site it is the largest available TTFB win. The requirement is cache key discipline: strip cookies that do not change the output, ignore marketing parameters, never cache personalised or logged in responses, and purge by URL or tag whenever a page is published.
Google treats 0.8 seconds or less as good. It is worth chasing because Largest Contentful Paint cannot happen before the first byte arrives, so TTFB sets a hard floor for the metric that actually gets assessed.
It changes what Googlebot experiences rather than the rules it follows. A cached response is faster, which tends to support higher crawl rates, and the Search Console crawl stats report shows average response time so you can watch the effect. The risk to avoid is a cache configuration that serves crawlers something different from users.
Hydration is a cost, not a defect. It runs after the HTML is visible, so it does not delay the first paint, but it occupies the main thread and can delay responsiveness to early taps. Reducing and splitting the JavaScript that hydration has to execute is what keeps that cost small.
Send a HEAD request to the URL and read the cache status response header your CDN sets, which reports a hit or a miss. Request the same URL twice, since the first request often populates the cache, and check from more than one region because edge nodes are populated independently.
Source: https://web.dev/wix/
Take this with you
The assistant links open with a question about this page already written. Nothing is sent until you press enter.
Claude Vincent is a technical SEO consultant focused on crawlability, rendering, and AI-search visibility. He writes the field guides and case studies at SEO ProCheck, with a bias toward the durable, unglamorous work that decides whether search engines and AI answer engines can actually read and cite a site.
About SEO ProCheck
Technical SEO consulting and GEO strategy with 20 years of enterprise experience. Case studies, resources, and tools for search and AI visibility.
Work With Me
Technical SEO audits, GEO strategy, site migrations, and international SEO. Hourly consulting for teams who need hands-on support, not just reports.
Subscribe to our newsletter!








Recent Posts
- Most Top Sites Never Say Who They Are in Structured Data October 14, 2026
- Homepage Titles Are Mostly Too Short, Not Too Long October 8, 2026
- Who Actually Serves an llms.txt? 184 Top Sites Measured September 29, 2026