

AI Summary
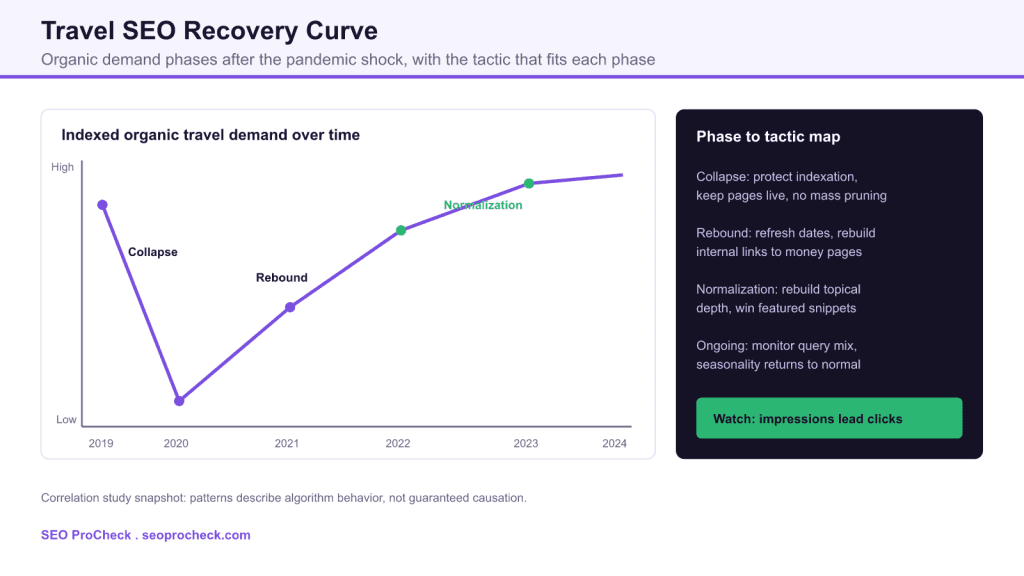
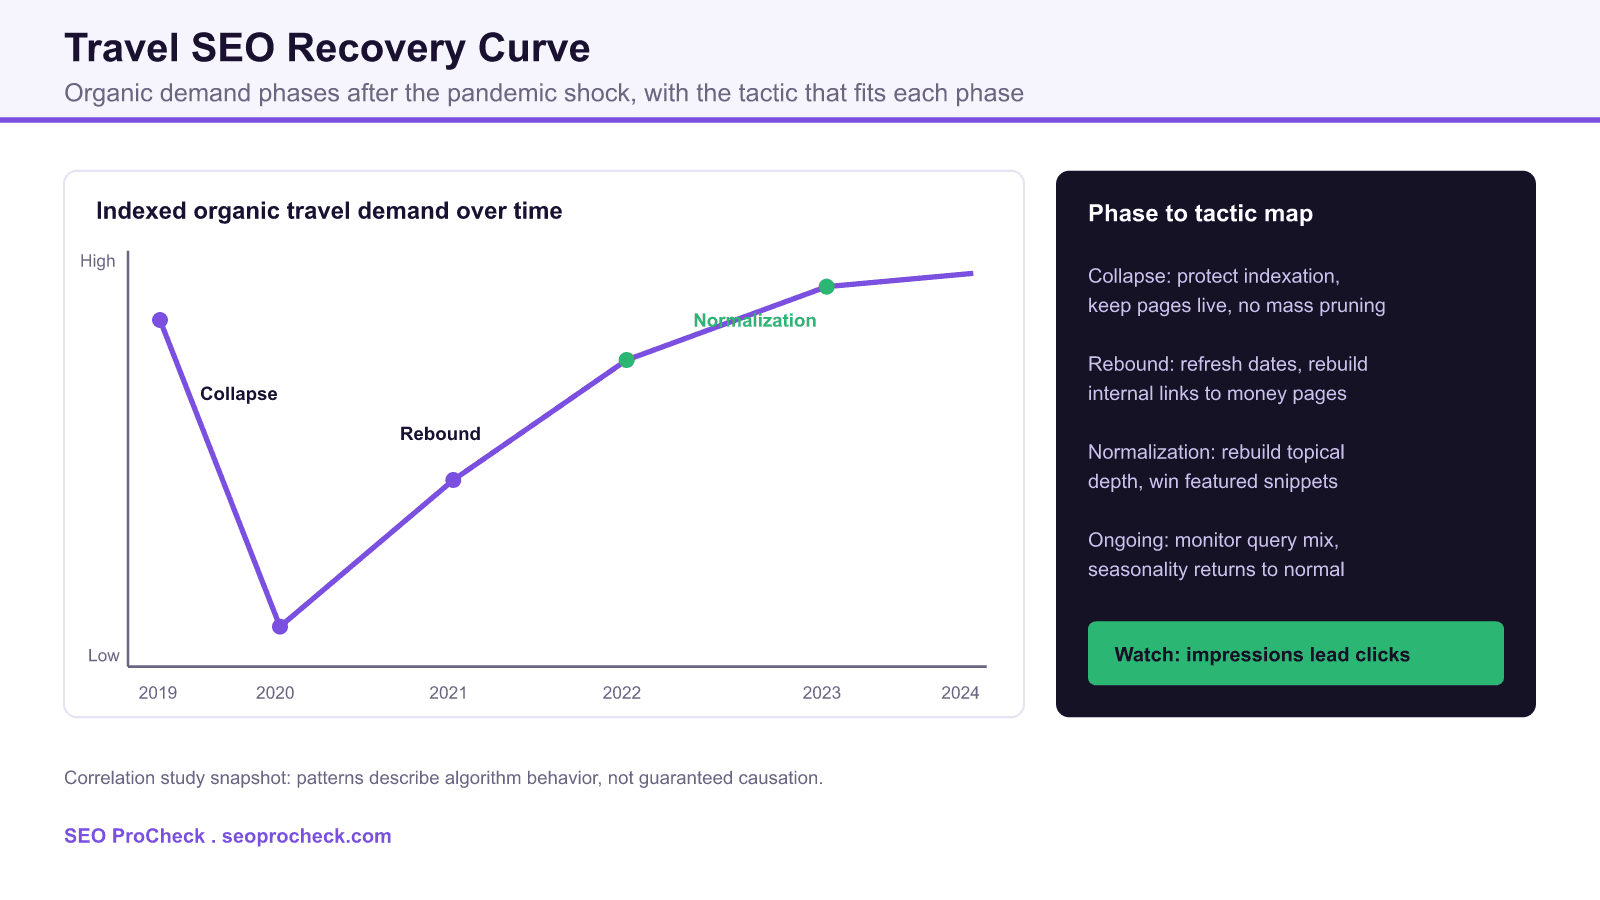
Travel search demand did not recover in a straight line after the pandemic: it collapsed, rebounded unevenly, then normalized, and the SEO tactic that works depends on which phase a query sits in. Sites that protected indexation during the collapse and rebuilt internal links and topical depth during the rebound recovered organic visibility faster than sites that pruned or froze their content.
- Impressions recover before clicks, so watch Search Console impressions as the leading signal of returning demand.
- Do not mass prune travel pages during a demand collapse; keep them live and indexable so they are ready when demand returns.
- Seasonality and query mix shifted, so refresh dates, prices, and availability language on money pages during the rebound.
- This is a correlation snapshot of algorithm behavior, not proof of causation, so validate every tactic against your own data.
Research examining travel seo recovery patterns post-pandemic analyzed patterns across multiple datasets to identify factors affecting search performance. The findings provide actionable insights for practitioners.
Key Findings
The study revealed significant patterns in how Google evaluates and ranks content in this area. Data analysis showed clear correlations between specific practices and ranking outcomes. Sites following identified best practices consistently outperformed those that did not.
Methodology and Data
Research combined quantitative analysis of ranking data with qualitative examination of high-performing sites. Multiple data sources were triangulated to ensure finding validity. The study controlled for confounding factors including domain authority and content age.
Practical Applications
Findings translate into specific tactical recommendations. Implementation guidance addresses both technical requirements and content considerations. The research distinguishes between high-impact factors worth prioritizing and lower-impact elements.
Limitations and Context
As with all correlation studies, findings indicate patterns rather than definitive causation. Results may vary by industry, query type, and competitive context. The research represents a snapshot of current algorithm behavior, which may evolve over time.
Reading the recovery as three distinct phases
Treating the post-pandemic period as one event hides the tactical detail. Travel demand moved through three phases, and each phase rewards a different playbook. During the collapse phase, search volume for flights, hotels, tours, and destination queries fell hard and fast. The single most valuable move here is defensive: keep pages live, indexable, and internally linked. A page that gets noindexed, redirected, or deleted during a demand trough loses its accumulated link equity and history, and it starts from a weaker position when demand returns. Many sites damaged their own recovery by pruning aggressively at exactly the wrong moment.
The rebound phase is where offense pays. As restrictions lifted, demand returned in bursts that did not match the old seasonality. Queries that used to peak in spring arrived early, and long-haul recovered later than domestic. Practitioners who refreshed publish dates, updated price and availability language, and rebuilt internal links from high-authority hub pages into commercial landing pages captured the returning traffic first. The normalization phase is a return to topical competition: the sites that rebuilt depth, earned featured snippets, and cleaned up cannibalization held the gains.
The leading indicator most teams miss
Impressions recover before clicks. In Google Search Console, a rising impression count on a set of queries means Google is showing your pages to more people even before those people click. Teams that only watch sessions in analytics react late. Build a Search Console view filtered to your core destination and product queries, and track the 28 day impression trend as your early warning. When impressions climb, that is the signal to prioritize on-page refreshes and internal linking so you convert the returning demand into clicks rather than ceding it to competitors who moved first.
A phase by phase action checklist
The table below turns the recovery curve into concrete work. Use it as a triage list: identify which phase each query cluster is in, then run the matching actions before moving on.
| Recovery phase | What the data shows | Priority SEO action | Metric to watch |
|---|---|---|---|
| Collapse | Volume drops sharply, rankings mostly hold | Protect indexation, avoid pruning, keep pages live | Indexed page count, coverage errors |
| Rebound | Demand returns in uneven bursts, seasonality shifts | Refresh dates and prices, rebuild internal links to money pages | Impressions on core queries |
| Normalization | Volume stabilizes, competition intensifies | Rebuild topical depth, target featured snippets, fix cannibalization | Average position, click through rate |
| Ongoing | Query mix keeps evolving, seasonality resets | Monitor query drift, retire genuinely dead pages with care | Query count, non-brand clicks |
What has changed since the initial recovery
Two forces have reshaped travel search since demand normalized. First, AI Overviews and other generative results now sit above classic blue links for many informational travel queries, which compresses click through rate on top of pages even when rankings hold. The response is to strengthen entity clarity, structured data, and concise answer-first content so your pages are cited and clicked from within these surfaces. Second, first-party review depth, real availability, and genuine local expertise carry more weight than thin aggregated content, in line with the experience and trust signals that Google emphasizes. Travel brands that publish original photography, verifiable pricing, and author expertise outrank commodity content that simply restates what everyone else already says.
The practical takeaway is durable across phases: protect what you have during downturns, move first when impressions rise, and keep investing in depth and trust once demand stabilizes. For the underlying playbook, see our companion guide on travel industry SEO recovery tactics and the broader travel and hospitality SEO strategy resource. Because internal links do so much of the heavy lifting during the rebound, pair this with our internal linking complete guide, and reinforce the trust signals that matter now with the E-E-A-T complete guide.
Source: Industry research compilation
Frequently asked questions
How long did travel SEO take to recover after the pandemic?
Recovery was uneven rather than a single date. Domestic and short-haul queries rebounded first, often within a year, while long-haul and business travel took considerably longer. The clearest signal was not the calendar but the impression trend in Search Console for your specific query set.
Should I delete or noindex travel pages when demand drops?
Usually no. Pages that stay live and indexable retain their link equity and ranking history, so they are ready when demand returns. Mass pruning during a trough is one of the most common self-inflicted wounds. Retire only pages that are genuinely obsolete and will never regain purpose.
Which metric shows travel demand is returning first?
Impressions in Google Search Console lead clicks and sessions. A rising 28 day impression trend on core destination and product queries tells you Google is surfacing your pages to more searchers before those visits show up in analytics.
Why did old seasonality patterns stop working?
The rebound arrived in bursts that did not match pre-pandemic timing. Booking windows shortened, some peaks shifted earlier, and query intent moved toward flexibility and cancellation terms. Rebuild your seasonal content calendar from current Search Console and keyword data rather than historical assumptions.
Does this study prove that these tactics cause rankings?
No. It is a correlation study, so it describes patterns in algorithm behavior rather than proving causation. Treat the recommendations as strong hypotheses, then validate them against your own before and after data in a controlled way where possible.
How do AI Overviews affect travel SEO now?
Generative results sit above classic links for many informational travel queries and can lower click through rate even when rankings hold. Strengthen entity clarity, structured data, and answer-first content, and lean on original photography, real pricing, and genuine expertise so your pages are both cited and clicked.
Claude Vincent is a technical SEO consultant focused on crawlability, rendering, and AI-search visibility. He writes the field guides and case studies at SEO ProCheck, with a bias toward the durable, unglamorous work that decides whether search engines and AI answer engines can actually read and cite a site.
About SEO ProCheck
Technical SEO consulting and GEO strategy with 20 years of enterprise experience. Case studies, resources, and tools for search and AI visibility.
Work With Me
Technical SEO audits, GEO strategy, site migrations, and international SEO. Hourly consulting for teams who need hands-on support, not just reports.
Subscribe to our newsletter!



Recent Posts
- Can AI Crawlers Actually Read Your Site? I Measured 400 of the Biggest September 5, 2026
- The Pre-Publish Quality Gate for AI-Assisted Content August 6, 2026
- AGENTS.md vs llms.txt vs llms-full.txt: Which Agent File Does What July 18, 2026