

AI Summary
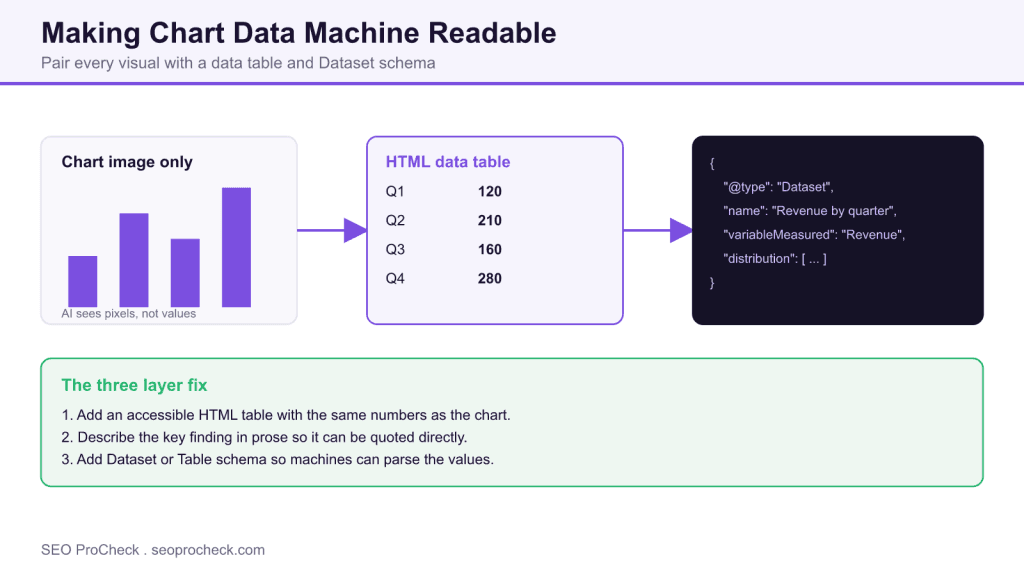
Data Visualization Markup is the practice of making the numbers inside charts and graphs machine readable, because AI systems and search engines cannot read values baked into an image. The fix is a three layer pattern: an accessible HTML data table, a plain text description of the key finding, and Dataset or Table structured data.
- Charts rendered as images or canvas hide their values from crawlers and AI models.
- Add an HTML table with the same numbers, a prose takeaway, and Dataset or Table schema.
- This helps AI answer engines quote your data and improves accessibility at the same time.
- Element code TE-008. Detect it with a schema and accessibility audit.

Element Code: TE-008
Quick Reference
Issue: Charts and data visualizations lack structured markup
Impact: Data not accessible to AI systems
Fix: Add structured data for data visualizations
Detection: Schema audit
What Is This Issue?
Data visualizations often contain valuable information that AI cannot access without proper markup. Structured data makes chart data machine-readable.
Why This Matters for Your Website
Data in charts is invisible to AI unless marked up or described in text.
How to Fix This Issue
- Add data tables: Accessible version of chart data
- Use schema: Dataset or Table schema
- Include text: Describe key findings in prose
Tools for Detection
- Schema validator: Check data markup
AI Search and GEO Considerations
Data in visualizations needs text or markup for AI accessibility.
TL;DR (The Simple Version)
Make data in charts accessible to AI by providing data tables, schema markup, or text descriptions of key findings.
Why a chart alone is invisible to machines
A chart that ships as a PNG, JPG or canvas element is pixels to a crawler. The trend is obvious to a human eye but there is no text layer stating that revenue rose from 120 to 280 across four quarters. Search engines and AI answer engines cannot cite what they cannot read, so a page full of insightful visuals can still contribute nothing to your machine readable footprint. SVG charts are better because they can contain text nodes, but even then the values are rarely structured in a way a model can reliably parse. The reliable fix is to publish the data in text and markup alongside the picture.
The three layer pattern
Layer 1: an accessible HTML data table. Restate the exact numbers behind the chart in a real table element. This gives crawlers, screen readers and AI systems the values directly, and it doubles as the accessible alternative that data visualization accessibility guidelines call for.
Layer 2: a prose takeaway. Write one or two sentences that state the headline the chart communicates, for example revenue grew 133 percent from the first to the fourth quarter. Answer engines love a quotable sentence that carries the conclusion.
Layer 3: structured data. Wrap the underlying data in Dataset or Table schema so machines can parse the series explicitly.
Example Dataset markup
{
  "@context": "https://schema.org",
  "@type": "Dataset",
  "name": "Revenue by quarter",
  "description": "Quarterly revenue for the year",
  "variableMeasured": "Revenue",
  "distribution": {
    "@type": "DataDownload",
    "encodingFormat": "text/csv",
    "contentUrl": "https://example.com/revenue.csv"
  }
}
For a table that lives directly in the page, the HTML table element combined with clear header cells is often enough for parsing, and it is the most robust option for accessibility. Reserve Dataset schema for cases where the data is a genuine dataset users might download or reuse.
How this connects to accessibility and GEO
The same table that makes your data machine readable also makes it usable by screen reader users, which ties this check to broader accessibility work such as giving an ARIA meter an accessible name. On the generative side, publishing values in text raises the chance that an answer engine retrieves and cites your figures, which links directly to the idea of a machine readable visualization and to structured data in general. If you use Dataset markup, our note on Dataset schema covers the required fields.
Markup options for chart data
| Approach | Best for | Machine readable | Accessible |
|---|---|---|---|
| HTML table | Values shown on the page | Yes | Yes |
| Dataset schema | Downloadable or reusable data | Yes | Indirect |
| Prose summary | The headline finding | Yes | Yes |
| Image alt text | Short description of the visual | Partial | Yes |
| Bare chart image | Visual impact only | No | No |
Frequently asked questions
What is data visualization markup?
It is the practice of exposing the numbers inside a chart to machines by adding an HTML data table, a text description of the finding, and Dataset or Table structured data. It ensures that crawlers and AI systems can read data that would otherwise be locked in an image.
Why can AI not read my charts?
Most charts are rendered as images or canvas, which contain pixels rather than a text layer of values. Without an accompanying table, description or schema, an AI system has no way to know what numbers the chart shows.
Should I use Dataset or Table schema?
Use an HTML table for values displayed directly on the page, since it is the most robust for both parsing and accessibility. Add Dataset schema when the data is a genuine dataset users might download or reuse.
Does a data table help accessibility too?
Yes. An accessible table is the standard alternative for chart data that screen reader users need, so this single fix improves both machine readability and accessibility at once.
How do I detect missing visualization markup?
Run a schema audit and an accessibility audit. Look for charts that appear only as images with no adjacent table, prose summary or structured data describing their values.
Does this help with AI Overviews and answer engines?
Yes. When your figures exist in text and structured data, answer engines can retrieve and cite them, which raises the chance your data appears in an AI generated answer.
Take this with you
The assistant links open with a question about this page already written. Nothing is sent until you press enter.
Claude Vincent is a technical SEO consultant focused on crawlability, rendering, and AI-search visibility. He writes the field guides and case studies at SEO ProCheck, with a bias toward the durable, unglamorous work that decides whether search engines and AI answer engines can actually read and cite a site.
About SEO ProCheck
Technical SEO consulting and GEO strategy with 20 years of enterprise experience. Case studies, resources, and tools for search and AI visibility.
Work With Me
Technical SEO audits, GEO strategy, site migrations, and international SEO. Hourly consulting for teams who need hands-on support, not just reports.
Subscribe to our newsletter!








Recent Posts
- Most Top Sites Never Say Who They Are in Structured Data October 14, 2026
- Homepage Titles Are Mostly Too Short, Not Too Long October 8, 2026
- Who Actually Serves an llms.txt? 184 Top Sites Measured September 29, 2026