

AI Summary
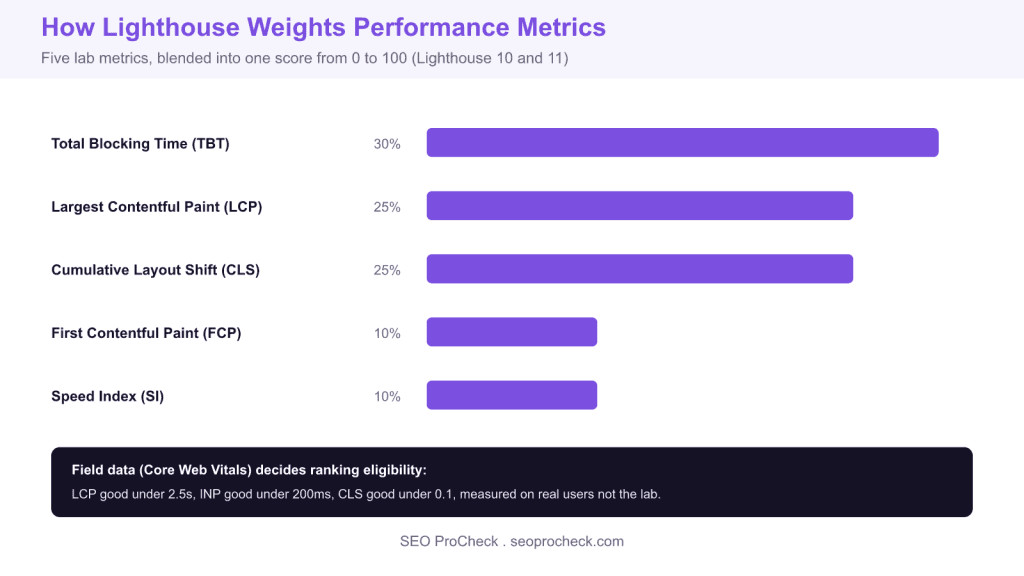
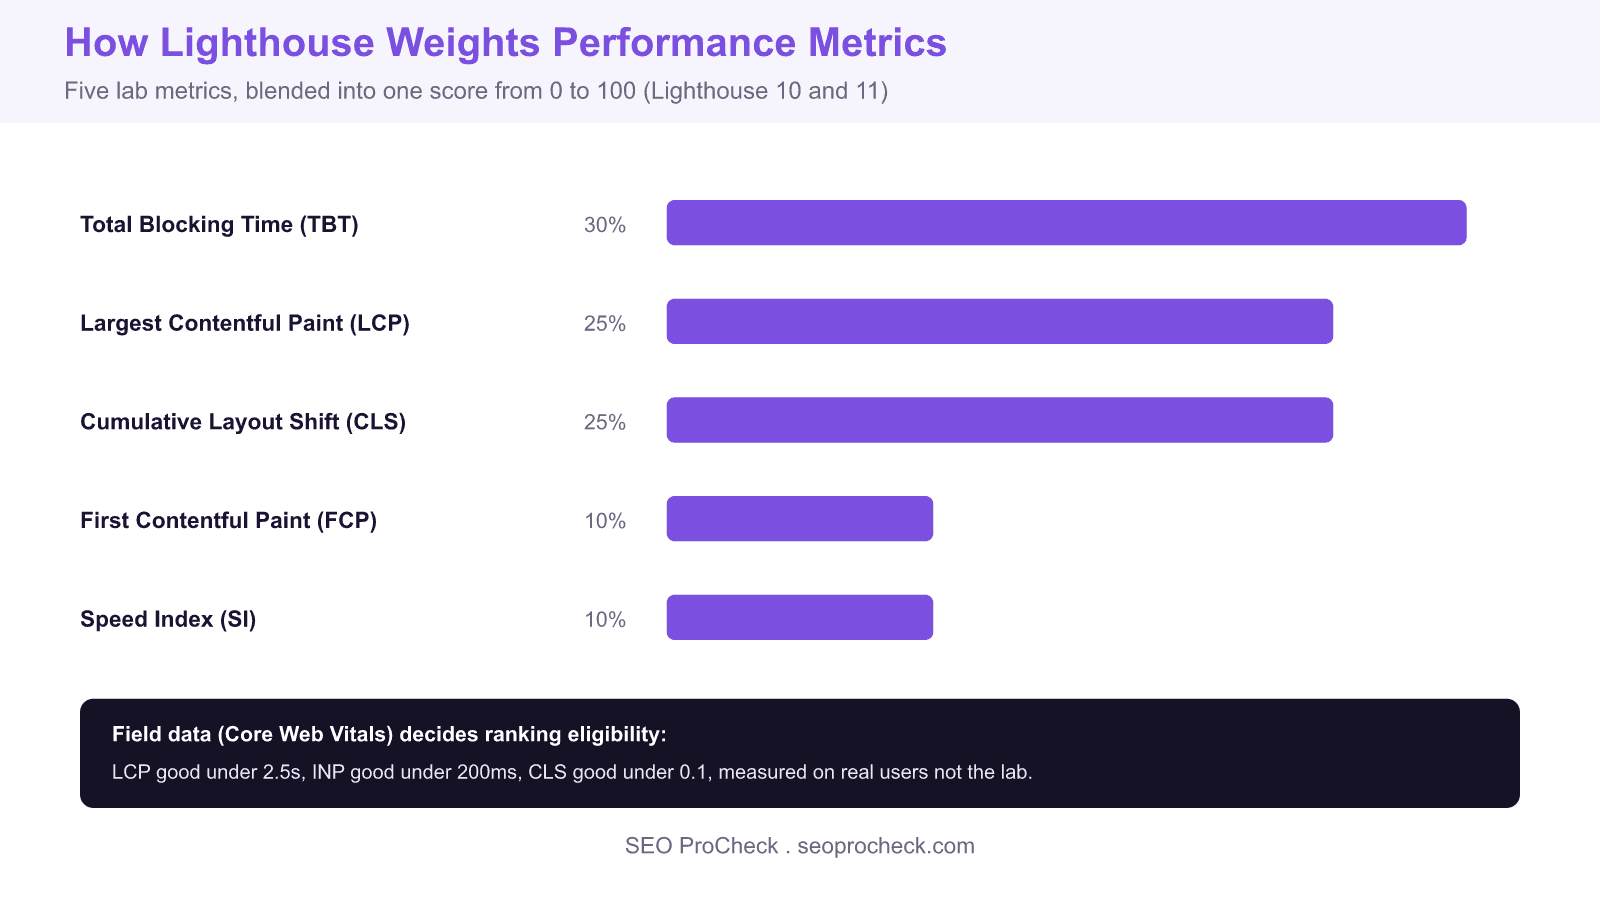
The Lighthouse performance score is a weighted blend of five lab metrics, with Total Blocking Time at 30 percent and Largest Contentful Paint and Cumulative Layout Shift at 25 percent each carrying most of the weight. That lab score is a debugging tool, while Google ranking uses the field based Core Web Vitals collected from real users.
- Score weights in Lighthouse 10 and 11: TBT 30%, LCP 25%, CLS 25%, FCP 10%, SI 10%.
- Lab data is repeatable for debugging; field data from CrUX is what Google ranks on.
- Core Web Vitals good thresholds: LCP under 2.5s, INP under 200ms, CLS under 0.1.
- INP replaced First Input Delay as a Core Web Vital in March 2024.
Lighthouse is the auditing engine behind the Performance tab in Chrome DevTools, PageSpeed Insights, and web.dev. Its 0 to 100 performance score is not a single measurement: it is a weighted blend of five lab metrics run in a simulated environment. Understanding which metrics carry the most weight, and how the lab score differs from the field data Google actually uses for ranking, is what separates a useful Lighthouse audit from chasing a vanity number.
The five metrics and how they are weighted
In Lighthouse 10 and 11 the performance score is calculated from these weights: Total Blocking Time at 30 percent, Largest Contentful Paint at 25 percent, Cumulative Layout Shift at 25 percent, First Contentful Paint at 10 percent, and Speed Index at 10 percent. Because TBT and LCP together account for more than half the score, main thread work and the loading of your largest above the fold element are where optimisation pays off most. Each metric is scored against a log normal curve derived from real site data, so shaving a second off a slow LCP moves the score far more than trimming an already fast one.
Lab data versus field data
This is the distinction that trips up most people. Lighthouse produces lab data: a single load under throttled, simulated conditions, useful for debugging because it is repeatable. Google ranking eligibility uses field data: the Core Web Vitals collected from real Chrome users in the Chrome User Experience Report, or CrUX. The two can disagree sharply. A page can score 95 in Lighthouse yet fail Core Web Vitals in the field because real users are on slower devices and networks. Always confirm the field verdict in the Core Web Vitals report in Search Console or the CrUX section at the top of PageSpeed Insights before declaring a page fixed.
Core Web Vitals and the INP change
Three metrics are the ones Google treats as ranking signals, and their good thresholds are worth memorising: Largest Contentful Paint under 2.5 seconds, Interaction to Next Paint under 200 milliseconds, and Cumulative Layout Shift under 0.1. Note that Lighthouse measures Total Blocking Time in the lab as a proxy for responsiveness, while the field metric is Interaction to Next Paint, which replaced First Input Delay in March 2024. They are related but not identical, so a good TBT in the lab makes a good INP in the field more likely without guaranteeing it, since INP captures every interaction across the whole visit.
Turning metrics into fixes
Each metric points at a specific class of work. High TBT means too much JavaScript executing on the main thread, so code split, defer non critical scripts, and remove unused polyfills. A slow LCP usually traces to a large hero image or render blocking resources, so preload the LCP image, serve it in a modern format, and inline critical CSS. CLS comes from layout jumps, so set explicit width and height on images and reserve space for ads and embeds. Read the Opportunities and Diagnostics sections of the Lighthouse report from the top: they are already ordered by estimated savings.
What has changed since older Lighthouse guidance
Two shifts matter for anyone reading dated tutorials. First, First Input Delay was retired as a Core Web Vital in March 2024 and replaced by Interaction to Next Paint, a stricter metric that looks at the slowest interaction across the entire page visit rather than only the first. Second, the metric weightings have been revised across Lighthouse versions: older Lighthouse 8 and 9 guides list different percentages and even include First Meaningful Paint, which has since been removed. Always check which Lighthouse version produced a report, shown in the footer, before comparing scores over time.
Lighthouse metrics at a glance
| Metric | Score weight | Good threshold | Main fix |
|---|---|---|---|
| Total Blocking Time | 30% | under 200ms (lab) | Reduce and defer JavaScript |
| Largest Contentful Paint | 25% | under 2.5s | Preload and optimise the hero element |
| Cumulative Layout Shift | 25% | under 0.1 | Reserve space for media and ads |
| First Contentful Paint | 10% | under 1.8s | Cut render blocking CSS and fonts |
| Speed Index | 10% | under 3.4s | Speed up visible content painting |
Related reading
- Fix the technical issues that hold pages back
- Balance technical work with the rest of SEO
- More technical SEO articles
Frequently asked questions
What is a good Lighthouse performance score?
A score of 90 to 100 is considered good, 50 to 89 needs improvement, and below 50 is poor. Remember this is lab data, so treat it as a debugging guide rather than the final word. Ranking eligibility depends on field based Core Web Vitals, which can differ from the lab score.
Which Lighthouse metric affects the score the most?
Total Blocking Time carries the highest weight at 30 percent, followed by Largest Contentful Paint and Cumulative Layout Shift at 25 percent each. That means reducing main thread JavaScript work and speeding up your largest above the fold element deliver the biggest score improvements.
What is the difference between lab data and field data?
Lab data comes from a single simulated load in a controlled environment, which makes it repeatable and ideal for debugging. Field data comes from real Chrome users through the CrUX dataset and is what Google uses to assess Core Web Vitals for ranking. A page can pass in the lab but fail in the field, so always check both.
Does the Lighthouse score directly affect Google rankings?
No, the Lighthouse lab score itself is not a ranking factor. Google uses the field based Core Web Vitals, Largest Contentful Paint, Interaction to Next Paint, and Cumulative Layout Shift, as part of its page experience signals. Lighthouse helps you diagnose and fix the issues behind those field metrics.
Why did INP replace First Input Delay?
First Input Delay only measured the delay before the browser began processing the first interaction, which many pages passed easily. Interaction to Next Paint, adopted in March 2024, measures the full latency of interactions across the whole visit, giving a more honest picture of responsiveness. It is a stricter, more representative metric.
How do I improve Total Blocking Time?
Total Blocking Time reflects long tasks that tie up the main thread, so reduce and split JavaScript, defer or lazy load non critical scripts, remove unused code and polyfills, and offload heavy work to web workers where possible. Third party scripts are a frequent cause, so audit and delay them wherever you can.
Technical SEO provides the foundation for content visibility. Without proper technical implementation, even excellent content may fail to rank. This resource covers technical considerations that enable search engines to effectively crawl, index, and rank your content.
Crawlability Essentials
Search engines must be able to discover and access your content. This requires proper robots.txt configuration, XML sitemaps, internal linking, and server reliability. Technical barriers to crawling prevent content from entering the ranking competition regardless of quality.
Indexation Optimization
Not all crawled pages get indexed. Ensuring pages provide sufficient unique value, avoiding duplicate content issues, and using canonical tags appropriately help control what gets indexed. Monitoring indexation status through Search Console reveals issues requiring attention.
Performance and Experience
Core Web Vitals and page speed affect both user experience and rankings. Technical optimizations including caching, compression, image optimization, and code efficiency improve performance metrics. These optimizations serve users while sending positive signals to search engines.
This resource provides guidance for building and maintaining the technical foundation that enables SEO success.
Source: https://www.searchenginejournal.com/core-web-vitals/google-lighthouse#close
Take this with you
The assistant links open with a question about this page already written. Nothing is sent until you press enter.
Claude Vincent is a technical SEO consultant focused on crawlability, rendering, and AI-search visibility. He writes the field guides and case studies at SEO ProCheck, with a bias toward the durable, unglamorous work that decides whether search engines and AI answer engines can actually read and cite a site.
About SEO ProCheck
Technical SEO consulting and GEO strategy with 20 years of enterprise experience. Case studies, resources, and tools for search and AI visibility.
Work With Me
Technical SEO audits, GEO strategy, site migrations, and international SEO. Hourly consulting for teams who need hands-on support, not just reports.
Subscribe to our newsletter!








Recent Posts
- Most Top Sites Never Say Who They Are in Structured Data October 14, 2026
- Homepage Titles Are Mostly Too Short, Not Too Long October 8, 2026
- Who Actually Serves an llms.txt? 184 Top Sites Measured September 29, 2026