

Server Response Time Optimization
- April 25, 2018
- Core Web Vitals and Performance, Technical SEO
AI Summary
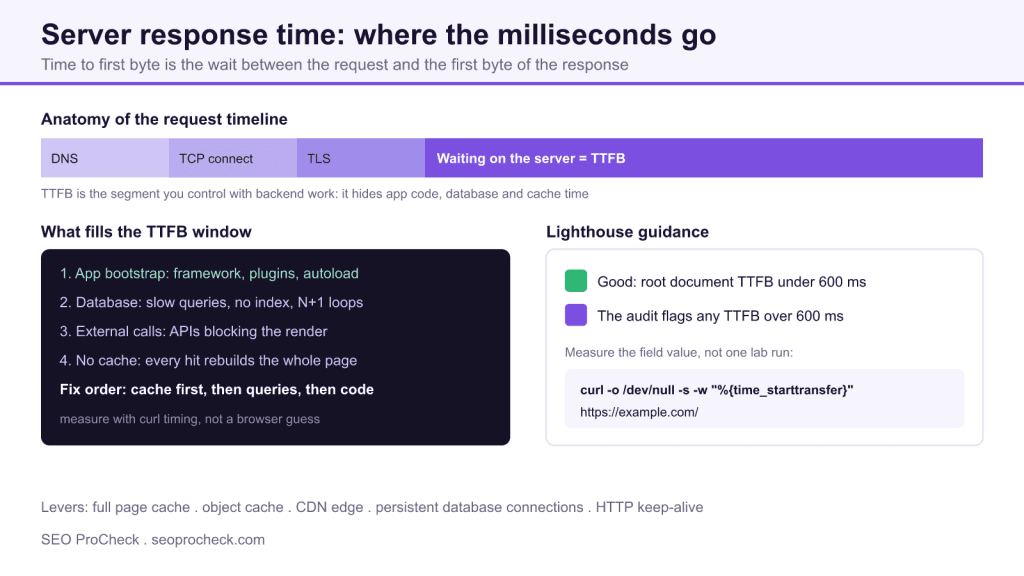
Server response time, measured as time to first byte, is the wait between a request and the first byte of the reply, and it is filled mostly by application bootstrap, database queries, external calls and missing caching. Fix it in order: cache the page, put a CDN in front, then profile slow queries and trim blocking third party calls, aiming to keep the root document under the 600 ms threshold Lighthouse flags.
- Lighthouse flags a root document time to first byte over 600 ms.
- Full page caching plus a CDN removes most application and database time for anonymous traffic.
- Measure with curl time_starttransfer and with field data, never a single warm browser load.
- A slow response delays Largest Contentful Paint and wastes crawl budget.
What server response time really measures
Server response time is the interval between the moment a client sends a request and the moment the first byte of the response comes back. Tooling reports it as time to first byte. It is the quietest metric in performance work because nothing is painted on screen while it ticks, yet it sets the floor for every visible milestone that follows. If the server takes 900 ms to answer, Largest Contentful Paint cannot happen before 900 ms no matter how lean the front end is.
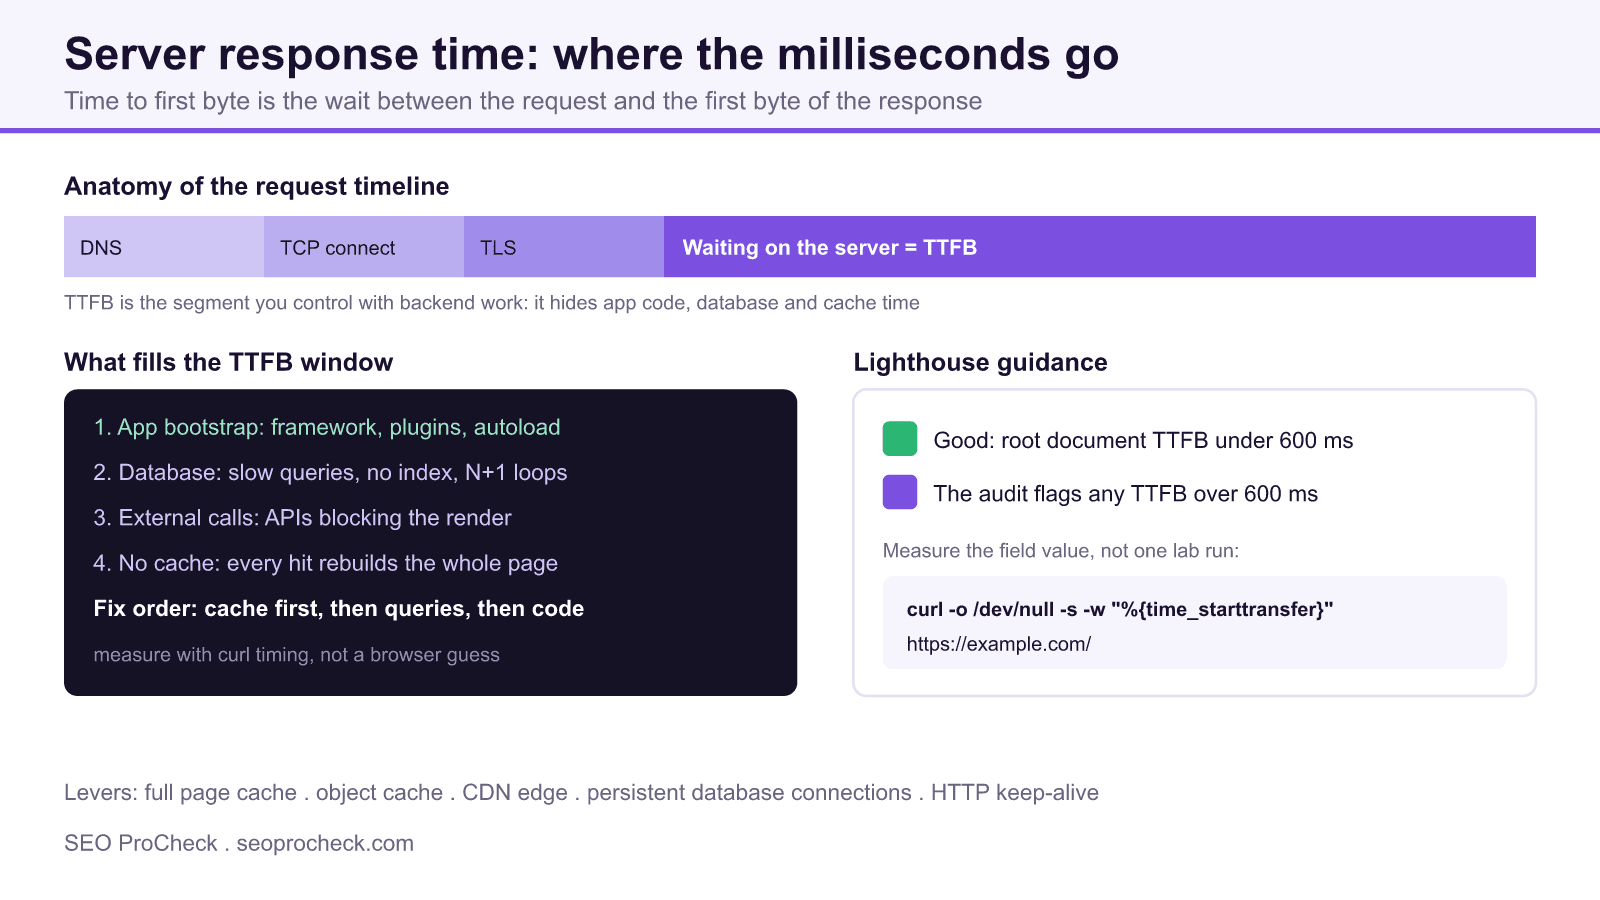
Strictly, the number covers a few phases: the DNS lookup that resolves your hostname, the TCP connection, the TLS handshake, and then the waiting segment where your application does its work. In practice the waiting segment dominates, so that is where optimisation pays off.
What fills the waiting window
When a response is slow, the cost almost always sits in one of four buckets. Working through them in this order gives the fastest wins for the least effort.
| Cause | Symptom | Fix |
|---|---|---|
| No page cache | Every hit rebuilds the full page | Full page cache plus CDN edge cache |
| Slow database | Unindexed or N plus 1 queries | Add indexes, add an object cache |
| Blocking API calls | Render waits on a third party | Cache the call or move it to async |
| Heavy bootstrap | Framework and plugins load per request | Trim plugins, enable opcode cache |
Measure before you touch anything
You cannot improve a number you have not pinned down. The cleanest server side measurement uses curl, which reports the exact seconds until the first byte without any browser rendering noise:
curl -o /dev/null -s -w "TTFB: %{time_starttransfer}s\nConnect: %{time_connect}s\nTLS: %{time_appconnect}s\n" https://example.com/Run it twice. A cold request shows the uncached cost, and a second warm request shows what caching buys you. If the warm number is close to the cold number, caching is not working. For real visitors, read the time to first byte metric in field data, because one lab run from your own fast connection hides the DNS, TLS and distance costs your audience actually pays.
The fix order that works
1. Full page caching
For anonymous traffic, the single biggest lever is serving a stored copy of the page instead of rebuilding it. A full page cache turns a 700 ms dynamic response into a static file read of a few milliseconds. On a typical stack this is a caching layer or plugin at the origin, configured to bypass the cache only for logged in users and cart or checkout paths.
2. A CDN in front of the origin
Once a cacheable copy exists, a content delivery network stores it at edge locations near your visitors, so the response no longer travels the full distance to your origin. This cuts both the connection setup time and the waiting time for cached routes. Set sensible cache headers so the edge knows how long to hold each response.
3. Database and object caching
For pages that cannot be fully cached, the next cost is usually the database. Profile the slow queries, add the missing indexes, and eliminate loops that run one query per row. An object cache such as Redis or Memcached keeps hot query results and computed fragments in memory so repeat requests skip the database entirely.
4. Application and connection tuning
Finally, trim what runs on every request. Remove unused plugins and modules, enable an opcode cache so code is not recompiled each time, keep persistent database connections open, and enable HTTP keep alive so repeat requests reuse an existing connection. These are smaller wins, but on a busy site they add up.
Confirm the gain
After each change, rerun the same curl command and record the number, then let field data accumulate for a couple of weeks to confirm the improvement holds for real users. The goal is a root document time to first byte comfortably under the 600 ms line, which clears the Lighthouse audit and gives the rest of your Core Web Vitals room to pass.
Frequently asked questions
What is a good server response time?
Google's Lighthouse audit named Reduce initial server response time flags the root document when its time to first byte exceeds 600 ms, so under 600 ms is the practical target for the main HTML request. Fast sites often sit well below 200 ms once full page caching and a CDN are in place. Judge the number from field data across real visits rather than a single lab run.
Is TTFB the same as server response time?
In everyday use they are treated as the same thing, because time to first byte is dominated by how long the server takes to build and start sending the response. Strictly, TTFB also includes the DNS lookup, TCP connection and TLS handshake that happen before the request reaches your application. When people say server response time they usually mean the waiting segment after the connection is open.
Does server response time affect rankings?
It affects rankings indirectly through Core Web Vitals. A slow response delays every other milestone, which pushes out Largest Contentful Paint and hurts the field data Google uses in the page experience signals. Faster responses also let crawlers fetch more pages per crawl budget, which helps large sites get indexed.
How do I measure TTFB accurately?
Use a command line timing rather than eyeballing a browser. curl with the time_starttransfer write out variable returns the exact seconds until the first byte, and repeating it warm and cold shows the effect of caching. For real user numbers, read the time to first byte metric in the Chrome User Experience Report or a field data tool.
Why is my TTFB fast in the browser but slow in tools?
A warm browser cache and an already open connection hide the real cost. Testing tools often measure a cold request from a different region, which exposes DNS, TLS and origin distance that your local machine had cached. Always compare like for like and test from the regions your visitors actually come from.
What is the fastest way to cut server response time?
Add full page caching so most requests are served without rebuilding the page, then put a CDN in front so the cached copy is served close to the visitor. Those two steps remove the bulk of application and database time for anonymous traffic. After that, profile slow database queries and trim blocking third party calls.
Related reading
- TTFB defined in the technical SEO glossary
- The reduce server response time check explained
- Core Web Vitals overview
- Site speed beyond Core Web Vitals
Take this with you
The assistant links open with a question about this page already written. Nothing is sent until you press enter.
Claude Vincent is a technical SEO consultant focused on crawlability, rendering, and AI-search visibility. He writes the field guides and case studies at SEO ProCheck, with a bias toward the durable, unglamorous work that decides whether search engines and AI answer engines can actually read and cite a site.
About SEO ProCheck
Technical SEO consulting and GEO strategy with 20 years of enterprise experience. Case studies, resources, and tools for search and AI visibility.
Work With Me
Technical SEO audits, GEO strategy, site migrations, and international SEO. Hourly consulting for teams who need hands-on support, not just reports.
Subscribe to our newsletter!








Recent Posts
- Most Top Sites Never Say Who They Are in Structured Data October 14, 2026
- Homepage Titles Are Mostly Too Short, Not Too Long October 8, 2026
- Who Actually Serves an llms.txt? 184 Top Sites Measured September 29, 2026