

AI Summary
Time to First Byte is the time from starting a navigation to the first byte of HTML arriving, and it is spent before your LCP budget even begins. It is not a Core Web Vital itself, but it sits inside LCP, so a slow TTFB throttles every downstream metric.
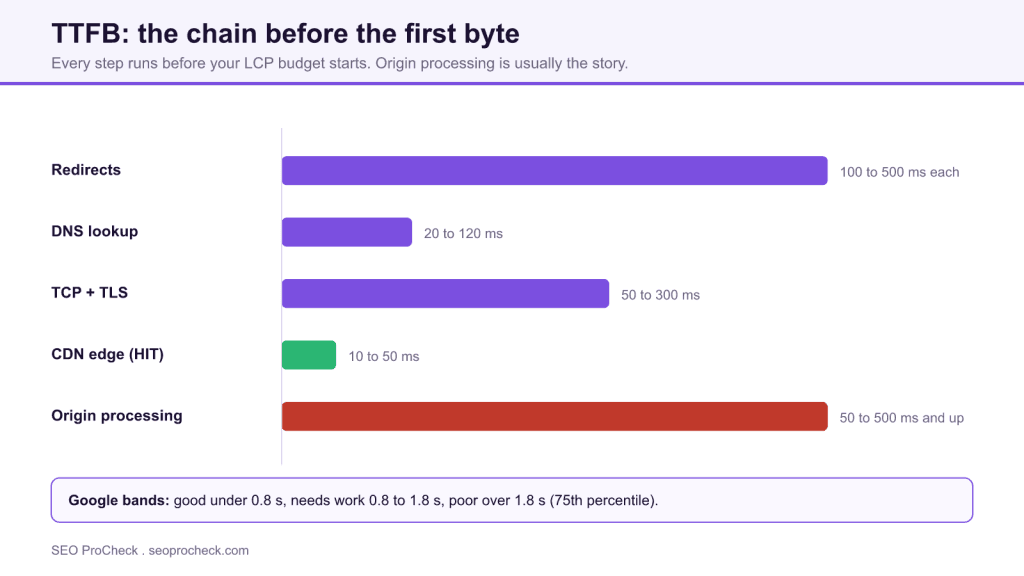
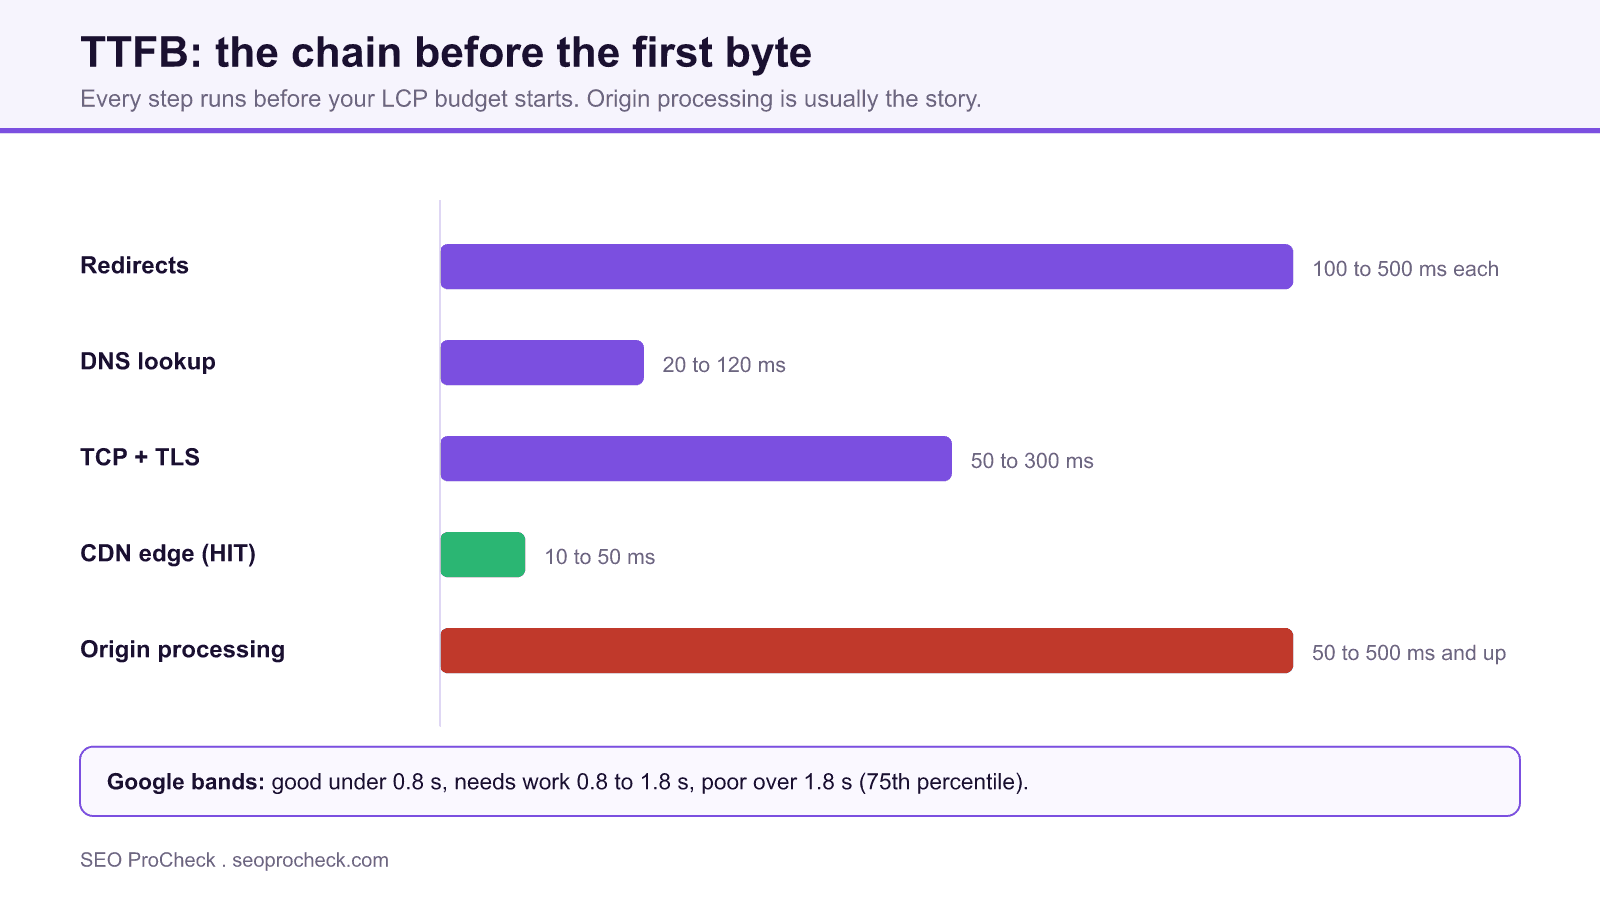
- Google's bands: good under 0.8 s, needs improvement 0.8 to 1.8 s, poor over 1.8 s at the 75th percentile.
- The chain is redirects, DNS, TCP and TLS, CDN edge, then origin processing, and origin is usually the variable that blows up.
- Measure the cache miss path deliberately, because cached sites are bimodal: fast on a HIT, slow on a MISS.
- Trust field data over a single terminal test, since your warm cache on fiber is the best case that will ever exist.
Time to First Byte (TTFB) is the time from a user starting a navigation to the first byte of the HTML response arriving in their browser. It is not one of the Core Web Vitals, but it is the opening act of all of them, because nothing on a page can start until the HTML shows up.
Here's the uncomfortable arithmetic: LCP has a 2.5-second "good" budget, and TTFB is spent first, before a single resource downloads or a single pixel paints. A 1.5-second TTFB leaves one second for everything else, fonts, CSS, hero image, render. Google's guidance for TTFB itself: under 0.8 s is good, 0.8 to 1.8 s needs improvement, over 1.8 s is poor. Sites chasing a good LCP should aim at the low end of that.
What actually happens before the first byte
TTFB is an umbrella over a whole chain of steps, and the chain is where you debug. In order:
| Layer | What happens | Typical cost | When it blows up |
|---|---|---|---|
| Redirects | Each hop restarts the whole connection dance | 0 ms if none; 100 to 500 ms each | http to https to www to trailing-slash chains; geo/mobile redirects |
| DNS lookup | Resolve the hostname to an IP | 20 to 120 ms cold | Slow DNS provider, long CNAME chains |
| TCP + TLS handshake | Open the connection, negotiate encryption | 1 to 2 round trips; 50 to 300 ms | Distant servers, no TLS 1.3, no session resumption |
| CDN edge | Edge cache answers directly on a HIT | 10 to 50 ms on HIT | MISS or BYPASS, the request travels on to origin |
| Origin processing | App boots, queries run, templates render | 50 to 500 ms; unbounded when broken | Uncached CMS pages, slow DB queries, cold serverless starts, overloaded shared hosting |
The pattern that matters: everything above "origin processing" is fixed overhead you minimize once (kill redirects, use a real CDN, enable TLS 1.3). Origin processing is the variable part, and on CMS sites it is nearly always the story. A WordPress page assembled from scratch on every request can spend a leisurely two seconds in PHP and MySQL; the same page from full-page cache leaves in 50 ms.
Measuring it honestly: two tools, thirty seconds
From your terminal, curl splits the chain apart for you:
curl -so /dev/null -w "
dns:       %{time_namelookup}s
connect:   %{time_connect}s
tls:       %{time_appconnect}s
ttfb:      %{time_starttransfer}s
redirects: %{num_redirects}
" -L https://example.com/
If ttfb is high but tls is low, the time is origin processing. If they're both high, you have a network/edge problem. In the browser, the same breakdown for real navigations:
const nav = performance.getEntriesByType('navigation')[0];
console.log({
  redirect: nav.redirectEnd - nav.redirectStart,
  dns:      nav.domainLookupEnd - nav.domainLookupStart,
  tls:      nav.connectEnd - nav.secureConnectionStart,
  ttfb:     nav.responseStart - nav.startTime
});
One warning: your curl from a desktop on fiber, hitting a warm cache, is the best case that will ever exist. Field TTFB includes users three continents away hitting cache misses on cellular. Expect the CrUX number to be substantially worse than your terminal, and trust the field number, the reasoning is the same as for every vitals metric (field vs lab data).
How to check TTFB on your own site
- PageSpeed Insights: the field data block includes an experimental TTFB distribution from CrUX; the lab section flags "Reduce initial server response time" when the first request is slow.
- Chrome DevTools Network panel: click the document request, open the Timing tab, "Waiting for server response" is your TTFB, split from queueing, DNS, and connection time.
- curl with -w timing variables (above) from more than one location if you can, TTFB is geographic.
- CrUX API: pull the origin's TTFB distribution to see the real-world spread across your audience.
- web-vitals library:
onTTFB(console.log)reports it per pageview for your own RUM, including cache-hit vs cache-miss variance you'll never see in one-off tests.
Common mistakes in TTFB audits
- Measuring once and calling it done. TTFB is bimodal on cached sites: 80 ms on a HIT, 1.9 s on a MISS. Check the cache-status response header (
x-cache,cf-cache-status) on every measurement, and measure the miss path deliberately. - Buying a CDN for uncacheable pages. If every HTML response is
Cache-Control: no-store(session cookies, cart state everywhere), the CDN is a fancy pipe to your slow origin. Fix cacheability first, then the CDN pays off. - Ignoring redirect chains. Three hops before the final URL can add a full second before "server time" even starts, and it's invisible if your test starts at the final URL. Test the URLs users and crawlers actually enter.
- Blaming hosting when the app is the problem. A 1.8 s TTFB with 40 unindexed database queries per page will follow you to more expensive hosting. Profile before you migrate.
- Optimizing TTFB last. It's the first phase of LCP; a saved second here is a second saved on every metric downstream. The remediation checklist lives in reduce server response times.
Frequently asked questions
Is TTFB a ranking factor?
Not directly, it isn't a Core Web Vital. But it's inside LCP, which is, and slow HTML delivery also throttles how efficiently Googlebot crawls large sites. Treat it as infrastructure for the metrics that do count.
What's a good TTFB target?
Google's documented bands: good under 800 ms, poor over 1800 ms, at the 75th percentile. For anything cacheable, be greedier, a CDN edge HIT should land well under 200 ms for most of your audience.
Does TTFB include redirect time?
As users and CrUX experience it, yes, measurement starts at the original navigation, so every hop is on the clock. This is why redirect-chain cleanup shows up directly in field TTFB.
Can TTFB be too fast to bother with?
If your field TTFB is already under ~500 ms at p75, your LCP problems live elsewhere, image delivery or render-blocking resources. Don't micro-optimize 80 ms while a 300 KB hero PNG walks free.
Server-side rendering made my TTFB worse, is that bad?
It's a trade: SSR spends server time to send ready-to-paint HTML, which usually wins on LCP overall versus shipping a blank shell that renders client-side. Judge the swap by LCP and INP outcomes, not by TTFB alone.
Claude Vincent is a technical SEO consultant focused on crawlability, rendering, and AI-search visibility. He writes the field guides and case studies at SEO ProCheck, with a bias toward the durable, unglamorous work that decides whether search engines and AI answer engines can actually read and cite a site.
About SEO ProCheck
Technical SEO consulting and GEO strategy with 20 years of enterprise experience. Case studies, resources, and tools for search and AI visibility.
Work With Me
Technical SEO audits, GEO strategy, site migrations, and international SEO. Hourly consulting for teams who need hands-on support, not just reports.
Subscribe to our newsletter!






Recent Posts
- Can AI Crawlers Actually Read Your Site? I Measured 400 of the Biggest September 5, 2026
- The Pre-Publish Quality Gate for AI-Assisted Content August 6, 2026
- AGENTS.md vs llms.txt vs llms-full.txt: Which Agent File Does What July 18, 2026