

AI Summary
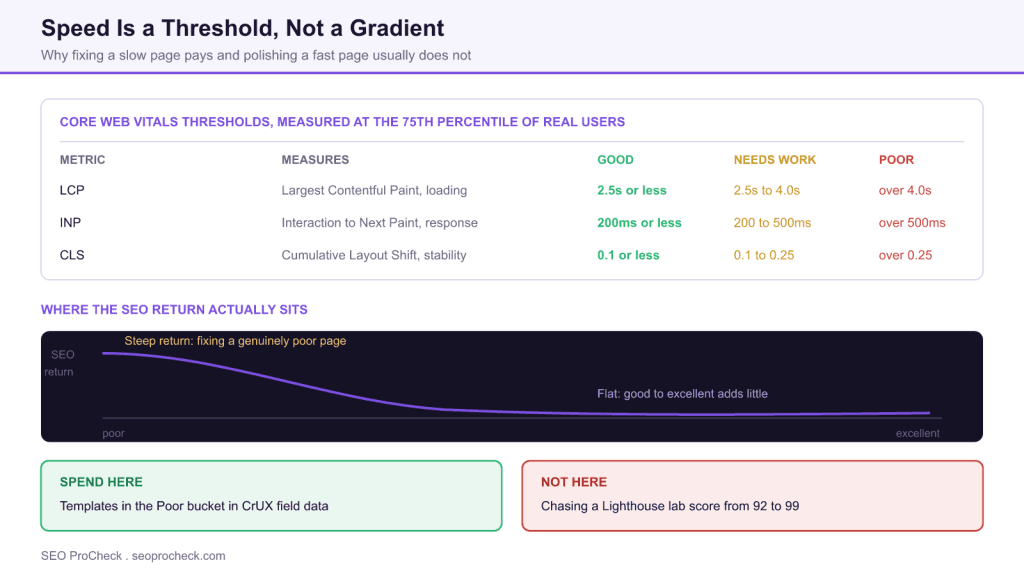
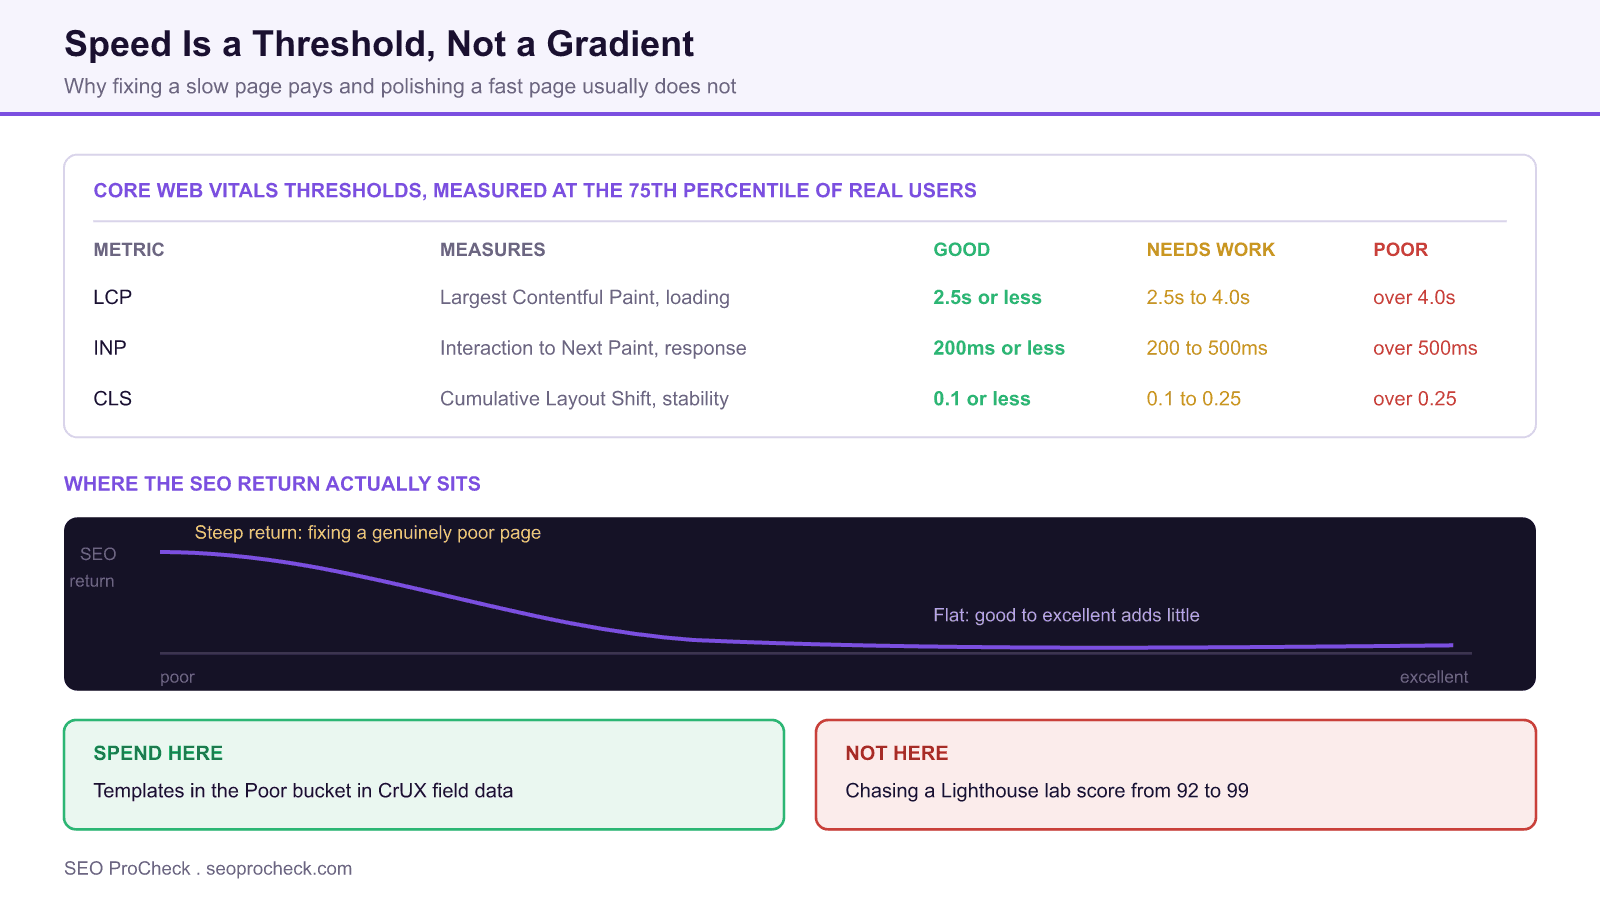
Page speed correlates with rankings, but the relationship is a threshold rather than a gradient: genuinely slow pages are penalised while the gap between good and excellent has little measurable ranking effect. The practical implication is to spend on templates sitting in the Poor bucket of your field data and to stop optimising pages that already pass.
- Core Web Vitals pass thresholds: LCP 2.5s or less, INP 200ms or less, CLS 0.1 or less, at the 75th percentile of real visits.
- INP replaced First Input Delay as a Core Web Vital in March 2024.
- Google evaluates page experience on field data from the Chrome User Experience Report, not on Lighthouse lab scores.
- Content relevance remains dominant: speed behaves as a tie breaker between comparable results.
- The underlying research for this entry was recorded only as compiled page speed research, with no retrievable citation.
This entry was filed with its source recorded only as compiled page speed research, with no author, publication or URL. We have not been able to retrieve an underlying study, so no findings are attributed to one and no statistics are quoted from it. Everything below that carries a number is either a published Google threshold or a documented product change, and is identified as such. Where the original summary made an unattributed claim it is retained as written and marked.
The original summary, retained
The four sections below are the original summary of the compiled research as it was filed. Practitioner commentary follows each one.
Speed as Ranking Factor
Page speed showed consistent but modest correlation with rankings. Extremely slow pages showed clear disadvantages. However, the difference between "good" and "excellent" speeds showed minimal ranking impact. Speed functions more as a baseline requirement than a competitive differentiator for already-fast sites.
This is the most useful sentence in the file and it matches what Google has said publicly. Speed entered ranking for mobile search in 2018 as what Google described as a factor affecting only the slowest experiences, and that framing has never really changed. The mental model to hold is a step function with a soft edge, not a slope. Below a certain quality of experience you are disadvantaged; above it, further improvement buys you conversion and cost benefits but very little ranking.
The operational consequence is that the correct unit of analysis is the distribution of your pages across the buckets, not the average. A site with a mean LCP of 2.4 seconds sounds healthy and can still have a product template where 40% of visits are over 4 seconds. Averages hide exactly the population that the signal is designed to catch.
Core Web Vitals Integration
Google's Core Web Vitals formalized speed evaluation through LCP, FID/INP, and CLS metrics. Passing CWV thresholds provided ranking benefits, though content relevance remained dominant. The combined page experience signal including CWV affected rankings but didn't override content quality.
Two clarifications. First, FID and INP are not alternatives: INP replaced FID as a Core Web Vital in March 2024 and FID was retired, so any tooling or reporting still keyed to FID is measuring something Google no longer uses. Second, the assessment runs on field data from the Chrome User Experience Report at the 75th percentile of real visits, which is why a page can look perfect in Lighthouse and still fail.
| Metric | What it measures | Good | Needs improvement | Poor |
|---|---|---|---|---|
| LCP | Time until the largest content element renders | 2.5s or less | 2.5s to 4.0s | Over 4.0s |
| INP | Latency of interactions across the whole visit | 200ms or less | 200ms to 500ms | Over 500ms |
| CLS | Unexpected layout movement during the visit | 0.1 or less | 0.1 to 0.25 | Over 0.25 |
| TTFB | Server response time, diagnostic not a Core Web Vital | 0.8s or less | 0.8s to 1.8s | Over 1.8s |
All three Core Web Vitals must be in the Good band at the 75th percentile for a URL group to pass. TTFB is included because it is the most common upstream cause of a failing LCP.
The 75th percentile rule is worth internalising because it changes where you look for problems. It means a quarter of your visits can be worse than the threshold with no consequence, and it means the visits that decide your result are the ones on mid range Android devices on congested mobile networks, not the ones on the developer's laptop.
User Behavior Connection
Slow pages showed higher bounce rates and lower engagement. These behavioral signals may contribute to ranking effects beyond direct speed evaluation. Improving speed improves user experience, which may create positive ranking effects through multiple channels.
The hedging in that paragraph is appropriate and should be kept. The link between speed and abandonment is well established in the analytics of essentially every large site, and the link between speed and revenue is the strongest commercial argument for the work. Whether user behaviour then feeds back into rankings as a separate mechanism is not something Google confirms in those terms, and it is not necessary to the business case.
That distinction matters when you are asking for engineering time. The revenue argument is measurable on your own data within a quarter. The indirect ranking argument is not, and leading with it invites a challenge you cannot answer.
Priority Assessment
For sites with major speed issues, optimization delivers meaningful benefits. For sites already performing reasonably, additional speed investment shows diminishing SEO returns. Speed optimization priority should be balanced against other SEO opportunities.
Correct, and the way to operationalise it is to stop treating speed as a site level project. Bucket your templates, then spend only where the bucket is Poor.
Running the triage
The whole assessment is roughly an hour of work. Start in Search Console, because it does the template grouping for you using real field data.
Search Console > Experience > Core Web Vitals
  Mobile report first, desktop second
  Sort issue groups by URL count, descending
  Note the failing metric per group: LCP, INP or CLS
Then pull the field data directly for a representative URL from each failing group, so you can see the full distribution rather than the pass or fail verdict.
curl -s 'https://chromeuxreport.googleapis.com/v1/records:queryRecord?key=YOUR_KEY' \
  -H 'Content-Type: application/json' \
  -d '{"url":"https://example.com/product/sku-1","formFactor":"PHONE"}' \
  | python3 -m json.tool

# Read record.metrics.largest_contentful_paint.percentiles.p75
# and the histogram bins, which show what share of visits sit in each bucket.
Only once you know which template and which metric is failing should Lighthouse enter the picture, and then only as a cause finder.
npx lighthouse https://example.com/product/sku-1 \
  --only-categories=performance \
  --form-factor=mobile \
  --throttling-method=simulate \
  --output=json --output-path=./lh-product.json

# The number that matters is not the score. It is:
#   audits['largest-contentful-paint-element']  what the LCP element is
#   audits['server-response-time']              whether TTFB is the cause
#   audits['layout-shift-elements']             what is moving
Where the fixes actually are
Failing metrics map to a small number of recurring causes. This table is the one to work down rather than a generic performance checklist.
| Failing metric | Most common cause | First fix to try | Where to verify |
|---|---|---|---|
| LCP | Slow server response, so nothing can render early | Cache at the edge, cut origin work, check database query time | TTFB in the CrUX record |
| LCP | Hero image discovered late by the preload scanner | Serve it as a plain img in the initial HTML with fetchpriority high, never lazy load it | Lighthouse LCP element audit |
| LCP | Render blocking CSS or webfonts in the head | Inline critical CSS, preload the font, set font display swap | Lighthouse render blocking resources |
| INP | Long JavaScript tasks blocking the main thread on interaction | Break up long tasks, defer third party scripts, reduce hydration work | Chrome DevTools Performance panel, long tasks |
| INP | Heavy event handlers on scroll, input or click | Debounce, move work off the main thread, yield to the browser | web-vitals library attribution build |
| CLS | Images and iframes without dimensions | Set explicit width and height or aspect ratio on every embed | Lighthouse layout shift elements |
| CLS | Late injected banners, ads or consent dialogs | Reserve the space with a fixed height container before the content loads | DevTools, record with layout shift regions on |
Third party scripts appear as the cause in the majority of real INP failures, and they are the fixes teams most often skip because ownership sits outside engineering.
What this study does not support
Because the original source is unattributed, a few things should not be claimed on the back of this page. It does not support a specific figure for traffic gained per second saved. It does not support the idea that passing Core Web Vitals will move a page past a more relevant competitor. And it does not support treating a Lighthouse score as the target, since the score is a lab composite and the ranking input is field data.
What it does support is the prioritisation rule, which is genuinely valuable and widely ignored: find the templates that are failing for real users, fix those, and stop.
Related reading on this site
For the metric definitions in depth, see Core Web Vitals in 2026: LCP, INP and CLS explained, and for the measurement distinction that trips up most teams, field data versus lab data. When you are ready to act, how to fix Core Web Vitals issues walks the remediation, and the Core Web Vitals impact study covers the ranking question directly.
FAQ
Yes, but a weak and conditional one. Google confirmed speed as a signal for mobile search in 2018 and folded it into the page experience signals with Core Web Vitals from 2021. Google has consistently described it as a tie breaker that matters most when content relevance is comparable, and relevance remains dominant. Treat it as a qualifying condition rather than a lever for outranking better content.
A page passes when the 75th percentile of real user visits meets all three: Largest Contentful Paint at 2.5 seconds or less, Interaction to Next Paint at 200 milliseconds or less, and Cumulative Layout Shift at 0.1 or less. The 75th percentile detail matters, because it means a quarter of your visits can be slower than the threshold and the page still passes.
Yes. Interaction to Next Paint became a Core Web Vital in March 2024, replacing First Input Delay, which was retired. INP is a harder metric to pass because it measures the full latency of interactions across the whole page visit rather than just the delay on the first one, so many sites that comfortably passed FID do not pass INP.
No. Lighthouse is a lab tool that simulates one throttled load on one device, and its score is a weighted composite that can be gamed without helping a single real user. Google evaluates page experience using field data from the Chrome User Experience Report. Use Lighthouse to diagnose causes and use CrUX to decide whether there is a problem worth diagnosing.
Nobody can answer that honestly for your site in advance, and any specific figure quoted without reference to your current field data is guesswork. What can be said is where the return is concentrated: templates currently in the Poor bucket in CrUX have real headroom, and templates already in the Good bucket generally do not. Measure your own distribution first.
Open the Core Web Vitals report in Search Console, which groups URLs into template level issue clusters using field data from real Chrome users. Work down from the largest Poor group. This is faster and more reliable than running Lighthouse on individual URLs, because it tells you which problem affects the most traffic rather than which page you happened to test.
Source: Page speed research compiled
Want to know which of your templates are actually failing?
An advanced audit reads your CrUX field data by template and ranks the fixes by traffic exposed.
Take this with you
The assistant links open with a question about this page already written. Nothing is sent until you press enter.
Claude Vincent is a technical SEO consultant focused on crawlability, rendering, and AI-search visibility. He writes the field guides and case studies at SEO ProCheck, with a bias toward the durable, unglamorous work that decides whether search engines and AI answer engines can actually read and cite a site.
About SEO ProCheck
Technical SEO consulting and GEO strategy with 20 years of enterprise experience. Case studies, resources, and tools for search and AI visibility.
Work With Me
Technical SEO audits, GEO strategy, site migrations, and international SEO. Hourly consulting for teams who need hands-on support, not just reports.
Subscribe to our newsletter!







Recent Posts
- Finding a Competitor's Sitemap, and Turning It Into a Change Log September 15, 2026
- AI Crawler User Agents: The Current Names, and Which Ones Sites Actually Block September 9, 2026
- Can AI Crawlers Actually Read Your Site? I Measured 400 of the Biggest September 5, 2026