

Optimizing Websites for Great User Experiences and Increased Conversions
- January 24, 2018
- Web Performance
AI Summary
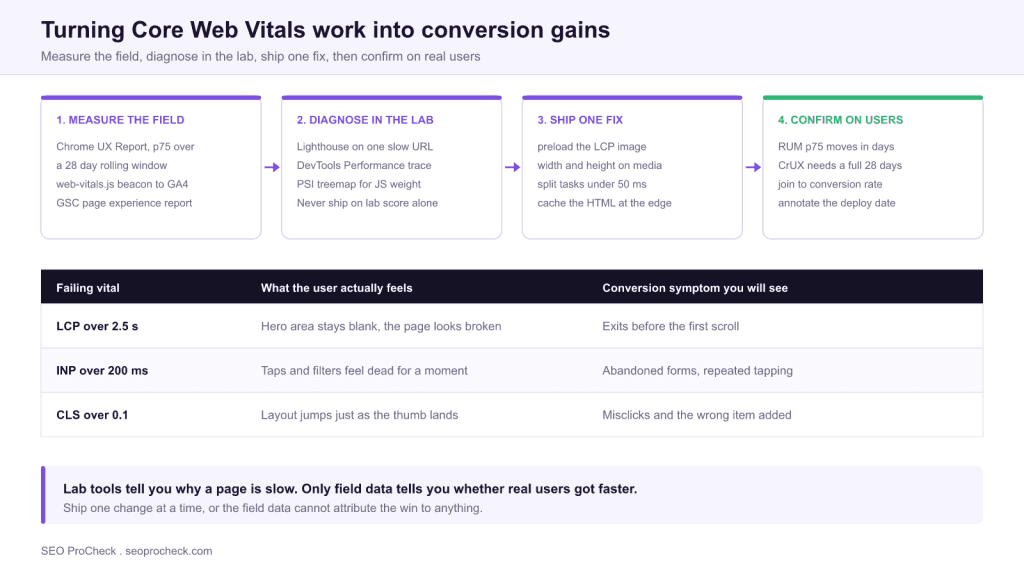
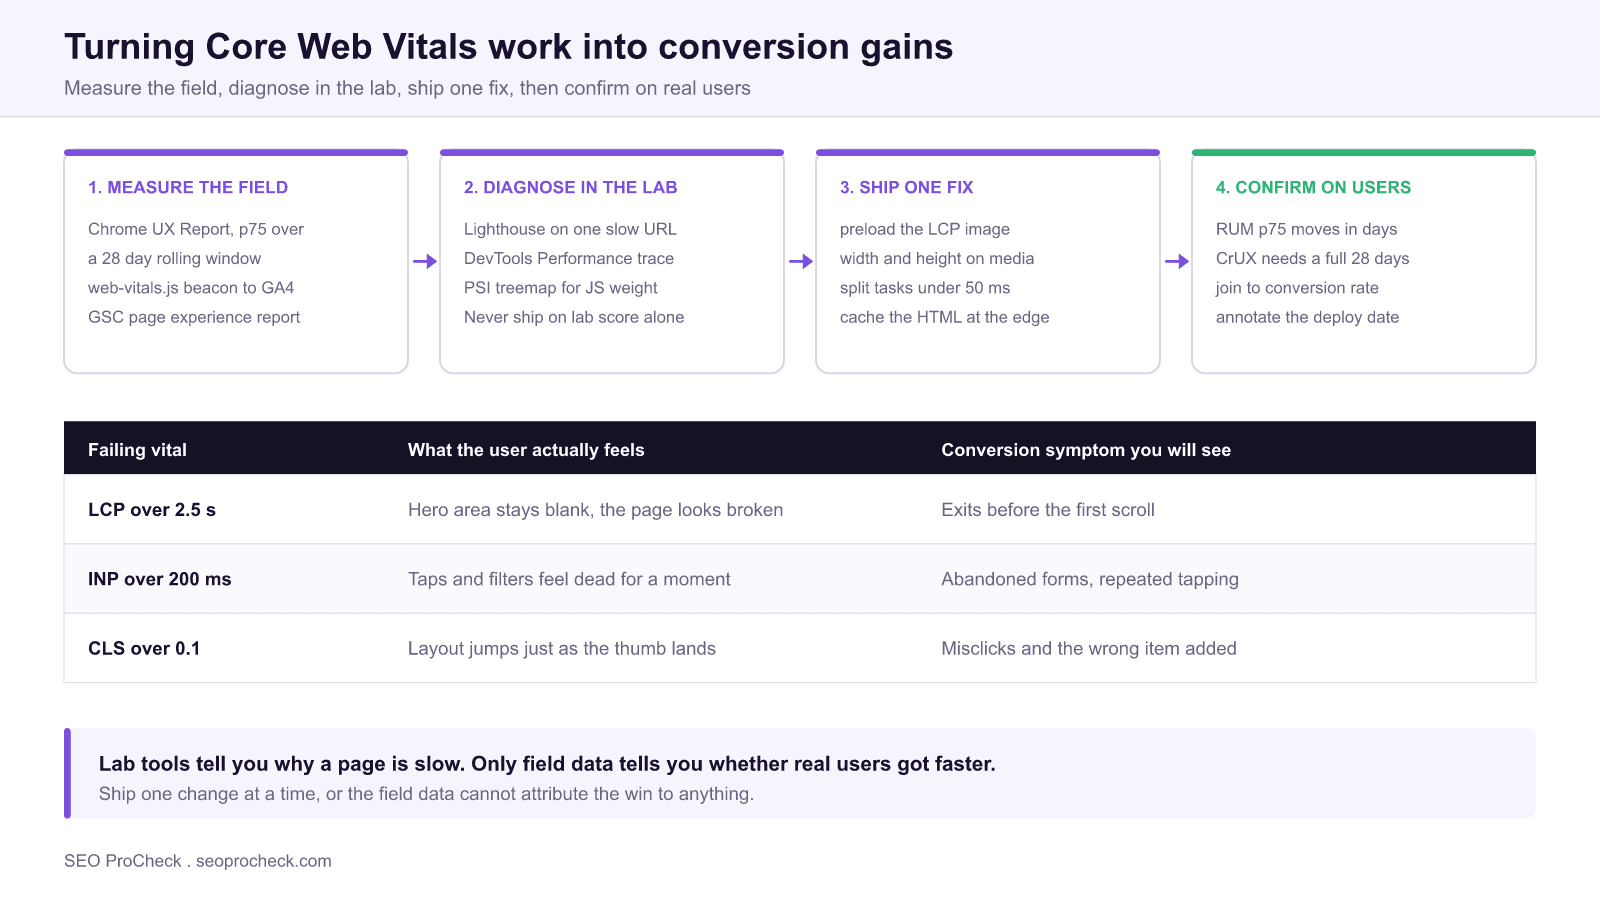
Optimizing a site for user experience and conversions means fixing the specific delays that make a page feel broken, then proving on real user data that the fix landed. The reliable loop is: read field data first, reproduce the problem in the lab, ship one change at a time, and wait for the field numbers to move before claiming a win.
- Field data (CrUX and your own RUM) decides whether users got faster. Lab tools such as Lighthouse only explain why a page is slow.
- Google's pass thresholds are measured at the 75th percentile: LCP under 2.5 s, INP under 200 ms, CLS under 0.1.
- CrUX moves on a 28 day rolling window, so a fix shipped today cannot show up in Search Console for roughly a month.
- Ship one change per deploy and annotate the date, otherwise you cannot attribute a conversion change to any single fix.
This technical SEO case study demonstrates how resolving technical issues and optimizing site infrastructure directly impacts organic visibility. The documented approach provides a template for technical optimization initiatives.
Technical Challenge
Technical SEO issues often create invisible barriers to ranking potential. This case study identifies the specific technical challenges addressed, from crawlability issues to performance bottlenecks. Understanding the problem scope helps practitioners diagnose similar issues.
In practice the barrier is almost never the thing the stakeholder points at. Teams arrive convinced that "the site is slow," but slow is not a diagnosis. The three Core Web Vitals fail for entirely different reasons and need entirely different fixes, so the first job is to split "slow" into a specific failing metric on a specific template. A product listing page that fails INP because of a heavy filter widget has nothing in common with a homepage that fails LCP because the hero image is discovered late by the preload scanner. Treating them as one project is how performance work stalls.
Start by naming the template, not the URL. Sites rarely have a performance problem on one page; they have it on a template that renders thousands of pages. Group your URLs by template (home, category, product, article, search results) and pick the worst performing template that also carries meaningful revenue or organic entrances. That intersection is where the work pays for itself.
Diagnostic Process
Identifying technical issues requires systematic analysis using crawling tools, log file analysis, and Search Console data. This case study documents the diagnostic methodology that uncovered actionable issues. The process itself provides value for practitioners building technical audit capabilities.
Where each number actually comes from
Most arguments about performance are really arguments about which data source someone is quoting. Lab and field numbers disagree by design, and neither one is wrong. This is the map worth pinning up before the first meeting.
| Source | Lab or field | Where to find it | Use it for |
|---|---|---|---|
| Search Console | Field (CrUX) | Experience → Core Web Vitals → Mobile or Desktop → Open Report | Finding which URL groups fail, at scale |
| PageSpeed Insights | Both | pagespeed.web.dev, one URL at a time | Comparing a single URL's field data against its lab run |
| CrUX History API | Field | chromeuxreport.googleapis.com/v1/records:queryHistoryRecord | Plotting the trend week by week around a deploy |
| Lighthouse | Lab | DevTools → Lighthouse panel, or npx lighthouse <url> | Reproducing an issue and testing a fix locally |
| Performance panel | Lab | DevTools → Performance, throttle to 4x CPU slowdown | Finding the exact long task blocking an interaction |
| Your own RUM | Field | web-vitals library beaconing to GA4 or a warehouse | Seeing movement in days, and joining to conversions |
The last row is the one teams skip, and it is the one that makes this work defensible. Search Console is free but lags by weeks and cannot be joined to your revenue data. A few lines of first party instrumentation fixes both problems:
import {onLCP, onINP, onCLS} from 'web-vitals';

function send({name, value, rating, id}) {
  gtag('event', name, {
    value: Math.round(name === 'CLS' ? value * 1000 : value),
    metric_id: id,
    metric_rating: rating,
    metric_value: value,
    send_to: 'G-XXXXXXX'
  });
}

onLCP(send);
onINP(send);
onCLS(send);
Once those events land in GA4 you can do the thing that actually convinces a finance stakeholder: build an exploration that segments sessions by metric_rating (good, needs improvement, poor) and compares conversion rate across the three buckets on the same template. That is a correlation, not proof of causation, but it reframes the conversation from "Google wants this" to "our own users behave differently when the page is slow."
For a deeper treatment of why these two data families disagree, see the guide on Core Web Vitals field data versus lab data, and for the metrics that matter beyond the three headline vitals, site speed beyond Core Web Vitals.
Implementation and Solutions
Each identified issue required specific technical solutions implemented within development constraints. The case study details solutions for rendering issues, performance optimization, crawl management, and indexation improvements. Implementation approaches balance ideal solutions with practical constraints.
The fix playbook, by symptom
Nearly every performance engagement resolves into a handful of recurring causes. This table is the shortlist that covers the majority of real cases, with the change you actually make and where you confirm it worked.
| Symptom | Usual cause | The change | Confirm in |
|---|---|---|---|
| LCP high, TTFB fine | Hero image discovered late, or lazy loaded | Remove loading="lazy" from the hero, add fetchpriority="high" | DevTools Network waterfall |
| LCP high, TTFB also high | Uncached HTML, slow origin, no edge cache | Cache HTML at the CDN edge, check Server-Timing | Response headers, cf-cache-status or equivalent |
| LCP is a text block | Web font blocking first paint | font-display: swap plus <link rel="preload" as="font" crossorigin> | Performance panel, font request timing |
| INP high on one control | A single long task on the click handler | Yield to the main thread, defer non urgent work | Performance panel, look for tasks over 50 ms |
| INP high everywhere | Third party tag manager scripts | Audit tags, remove the dead ones, delay the rest | DevTools Coverage tab for unused bytes |
| CLS spikes late | Injected banner, ad slot, or cookie bar | Reserve the height with min-height before injection | Performance panel, Layout Shift markers |
| CLS on images | Missing intrinsic dimensions | Set width and height attributes, or CSS aspect-ratio | Lighthouse, "Image elements do not have explicit width and height" |
Two implementation notes that save weeks. First, breaking a long task is usually a one line change: wrap the non urgent half of a handler so the browser can paint between the two pieces.
button.addEventListener('click', async () => {
  applyVisualState();               // cheap, do it now so the tap feels instant
  await new Promise(r => setTimeout(r, 0));  // yield, let the browser paint
  recalculateFacetsAndAnalytics();  // expensive, do it after the paint
});
Second, resist the urge to bundle. If a release contains an image fix, a font fix and a tag cleanup, and the numbers move, you have learned nothing transferable. One change per deploy is slower for a sprint and far faster over a quarter, because you build a real internal model of what your stack responds to.
Measurable Impact
Technical improvements demonstrate value through measurable outcomes: improved crawl stats, faster indexation, better Core Web Vitals scores, and ultimately improved rankings and traffic. This case study quantifies the impact of technical optimization.
Reading the result honestly
The measurement trap in performance work is timing. Your own RUM will show movement within a day or two of the deploy, because it reports on the sessions happening right now. Search Console will not, because CrUX aggregates a 28 day rolling window: the day after your fix, 27 of those 28 days still contain the old, slow experience. Teams routinely panic in week two and roll a good fix back. Put the expected dates in the ticket before you ship:
- Day 0: deploy, annotate the date in GA4 and in your RUM dashboard.
- Day 2 to 3: your own field data should show the new p75 on the affected template. If it does not, the fix did not reach real users. Check that it is live, not behind a flag, and not cached.
- Day 28 to 35: CrUX and Search Console should reflect the change. Search Console groups also need a validation pass, which adds time.
- Week 6 onward: only now is it reasonable to look for downstream effects on entrances and conversion rate, and even then seasonality and other releases are competing explanations.
Be equally honest about what page experience is and is not. Core Web Vitals are a real but modest ranking input, and they will not lift a page that does not deserve to rank. The dependable return is on the conversion side: users who can see and tap the thing they came for complete more of what they started. Frame the business case that way and the work survives budget review; frame it as a ranking lever and it does not.
If you are pairing this with a broader technical review, the technical SEO audit entry covers where performance sits alongside crawl and indexation checks, and the INP guide goes deep on the responsiveness metric that most often surprises teams after they have already fixed LCP.
Common mistakes that undo the work
- Optimizing the Lighthouse score instead of the metric. The performance score is a weighted composite on a synthetic device. Chasing 100 there can leave your real p75 untouched.
- Testing on the office connection. Always throttle. A fast laptop on fibre hides every problem your mobile users have.
- Using the average instead of the 75th percentile. Averages hide the tail, and the tail is where the abandonment happens.
- Fixing the homepage. It is the page everyone looks at and rarely the page that carries entrances or revenue. Fix the money template first.
- Not annotating the deploy date. Six months later nobody remembers what shipped when, and the data becomes unreadable.
Technical SEO case studies like this one help practitioners understand the tangible value of investing in site infrastructure.
FAQ
Expect roughly 28 days minimum, because CrUX reports a 28 day rolling window and the days before your deploy still carry the old experience. Your own real user monitoring will show the change within two or three days, which is why first party instrumentation is worth the setup.
They are a confirmed but lightweight ranking input, useful mainly as a tiebreaker between pages of similar relevance. They will not rescue content that does not match the query. The stronger and more reliable payoff is on engagement and conversion rate, which is where the business case belongs.
Lighthouse is a single synthetic run on a simulated device and network. Search Console reports what real Chrome users experienced at the 75th percentile, across every device and connection that visited. A clean lab score with a failing field score usually means your real audience is on slower hardware than your test profile assumes.
Fix whichever one is failing on the template that carries your entrances or revenue. If several fail at once, LCP is usually the cheapest to move because the causes are few and well understood, while INP tends to require touching application code and third party tags.
A URL group passes when the 75th percentile of real user measurements is at or under 2.5 seconds for LCP, 200 milliseconds for INP, and 0.1 for CLS. All three must pass on the device class being evaluated, and mobile and desktop are assessed separately.
Yes, at a useful approximation. Send the web-vitals library output to GA4 as events carrying the metric rating, then build an exploration comparing conversion rate for good, needs improvement, and poor sessions on the same template. It is correlational rather than causal, but it is enough to justify the engineering time.
Take this with you
The assistant links open with a question about this page already written. Nothing is sent until you press enter.
Claude Vincent is a technical SEO consultant focused on crawlability, rendering, and AI-search visibility. He writes the field guides and case studies at SEO ProCheck, with a bias toward the durable, unglamorous work that decides whether search engines and AI answer engines can actually read and cite a site.
About SEO ProCheck
Technical SEO consulting and GEO strategy with 20 years of enterprise experience. Case studies, resources, and tools for search and AI visibility.
Work With Me
Technical SEO audits, GEO strategy, site migrations, and international SEO. Hourly consulting for teams who need hands-on support, not just reports.
Subscribe to our newsletter!







Recent Posts
- Finding a Competitor's Sitemap, and Turning It Into a Change Log September 15, 2026
- AI Crawler User Agents: The Current Names, and Which Ones Sites Actually Block September 9, 2026
- Can AI Crawlers Actually Read Your Site? I Measured 400 of the Biggest September 5, 2026